Illustrative Mathematics
Art Class, Assessment Variation
Play with paint and decide the ratio to make different shades of green. When mixing paint colors, your painters should decide which ratios make the same shade and what is needed to mix other ratios for a different shade of green. This is...
Curated OER
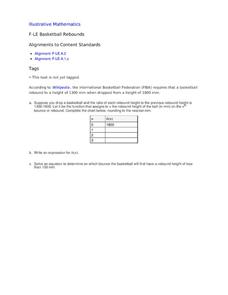
Basketball Rebounds
Your young basketball players will build a table and develop a general formula for a decaying exponential scenario involving the rebound distance of a bouncing ball. Using a CBR and graphing calculator can make this even more hands-on...
Shelby County Schools
Atomic Structure Worksheet
Teaching young scientists about atoms is no small task, but this series of worksheets will make it a little easier. From creating and labeling Bohr models, to identifying information provided in the periodic table of elements, this...
Curriculum Corner
7th Grade Math Common Core Checklist
With so many math standards to fit into a school year, it can be difficult keeping track of what you have and have not covered. This collection of Common Core checklists allows you to maintain a running record of when each standard was...
Illustrative Mathematics
Bank Shot
Young geometers become pool sharks in this analysis of the angles and lengths of a trick shot. By using angles of incidence and reflection to develop similar triangles, learners plan the exact placement of balls to make the shot....
NASA
Lost in Space: Bone Density
If you don't use it, you lose it. Groups work together to compare bone loss on Earth as opposed to bone loss in space. They determine the equations that model bone loss and make calculations to determine the amount of bone loss for...
Virginia Department of Education
Solution Concentrations
What happens when you combine 6.022 times 10 to the 23 piles of dirt into one? You make a mountain out of a mole hill. Scholars use dehydration to obtain percent composition and then calculate the molarity of the original solution.
Exploratorium
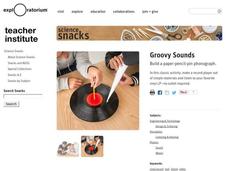
Groovy Sounds
Make music. Class members construct a simple record player using a paper cone and a pin. The resource provides a description of what is happening and why listeners can hear the sounds through the cone.
It's About Time
Electricity and Your Community
Young scientists read and interpret a data table about energy generation around the world. Next, they use the Internet to investigate energy generation in their own state, and, finally, pupils read a passage and answer questions about it.
Math Wire
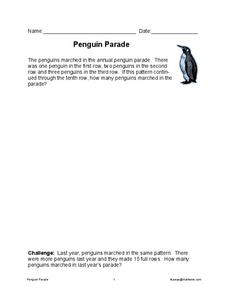
Penguin Parade
Make way for the penguin parade! Based on a given pattern of penguins in an ascending number of rows, how many penguins were marching this year? Learners solve two word problems to find the answer.
University of Colorado
Looking Inside Planets
All of the gas giant's atmospheres consist of hydrogen and helium, the same gases that make up all stars. The third in a series of 22, the activity challenges pupils to make scale models of the interiors of planets in order to...
Radford University
A Change in the Weather
Explore the power of mathematics through this two-week statistics unit. Pupils learn about several climate-related issues and complete surveys that communicate their perceptions. They graph both univariate and bivariate data and use...
Virginia Department of Education
Graphs
Examine different types of graphs as a means for analyzing data. Math scholars identify the type of graph from a series of data displays and then develop questions to match each one. Then, given a scatter plot of height versus age data,...
EngageNY
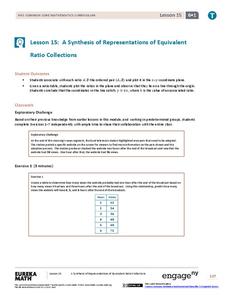
A Synthesis of Representations of Equivalent Ratio Collections
Make all the ratio representations fit together. The 15th segment in a series of 29 presents ratio problems to solve. Scholars use a variety of representations to respond to the questions. The problem set has pupils show how the...
Cornell University
Isotope Rummy
Thanks to this game, teaching isotopes will never be the same. Physical science scholars work their way toward understanding isotopes in an entertaining game. Pupils play rummy in groups while practicing good sportsmanship and creating...
Howard County Schools
Generous Aunt
Witness the power of exponential growth with an activity that investigates two different savings plans. Class members create tables of values to see how and when a savings plan increasing exponentially exceeds one increasing linearly.
5280 Math
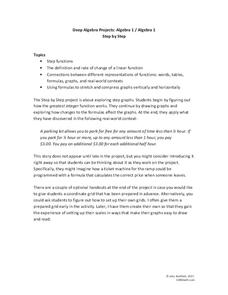
Step by Step
One step at a time! A seemingly linear relationship becomes an entirely new type of function. Young scholars build their understanding of step functions by completing a three-stage activity that incorporates multiple representations of...
Mathematics Vision Project
Module 9: Statistics
All disciplines use data! A seven-lesson unit teaches learners the basics of analyzing all types of data. The unit begins with a study of the shape of data displays and the analysis of a normal distribution. Later lessons discuss the...
Concord Consortium
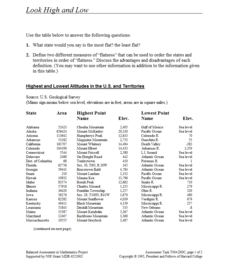
Look High and Low
From the highest high to the lowest low here's a resource that won't fall flat. Given data on the area and the highest and lowest elevations of each of the 50 states, learners decide which states are the least flat and the most flat. Of...
Curated OER
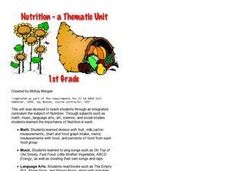
Nutrition: A Thematic Unit
Young learners explore nutrition and the food groups in these two mini-lesson plan ideas. First, kindergarteners have a discussion about their health and how different foods contribute to it before making their own personal food pyramid....
Curated OER
Range, Cluster, Gap and Outliers
There are a number of activities here where learners collect and record data, as well as, activities where the likelihood of an event happening is calculated given the experimental probability. Young statisticians organize information...
Curated OER
From Gene to Protein ~ Transcription and Translation
Translate the process of protein synthesis to your molecular biologists with this instructional activity. It consists of reading, completing a table as a summary, comprehension questions, and a modeling activity for both transcription...
Curated OER
Respiration
This series opens with diagrams of experimental setups. A data table is displayed and questions are asked, indicating that the intent is for lab groups to perform the depicted experiments. At slide twelve, a coherent lesson about the...
Polar Trec
Animal Monitoring Introduction
Not only do mealworms taste great, they are also great for classroom science lessons. In pairs, young scientists observe and record what they see as they check out what their mealworms are doing from minute to minute. Each minute...
Other popular searches
- Make a Table to Problem Solve
- Math Make a Table
- Economics Make a Table
- Multiplication Make a Table
- Use or Make a Table
- Problem Solving Make a Table


