Curated OER
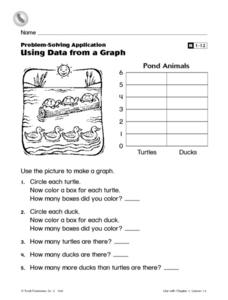
Using Data From a Graph
In this graphing worksheet, students create a bar graph with information from a picture of some pond animals. Students answer 5 questions about the graph.
Curated OER
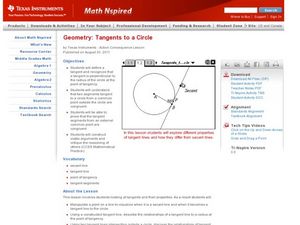
Tangents to a Circle
Young scholars construct tangent lines. In this geometry instructional activity, students identify the point of tangency, secant and tangent lines. They graph the lines on the Ti and make observations.
Curated OER
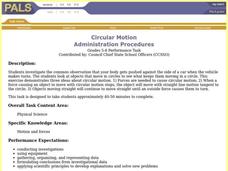
Circular Motion
Students investigate circular motion in two different activities. In the first, students observe the path of a rolling marble on a paper plate. In the second, students play a game of catch using a tennis ball inside a plastic bag. ...
Curated OER
BUS: Farming: It's A Fact (Ag)
Learners create two different types of graphs from the information in the "Farm Facts" booklet (i.e., bar graph, pie chart, etc.). They calculate where your food dollars are spent (on and off farm).
Curated OER
Conic Sections and Nonlinear Systems of Equations
In this conic sections and nonlinear equations worksheet, students solve 25 multiple choice problems. The worksheet is a review of the conic sections and nonlinear systems chapter of an intermediate algebra course, so the topics vary...
Curated OER
The Solar System
Students construct a sketch of the planets in our solar system using concentric circles and angles. In this solar system lesson plan, students plot the position of each planet on concentric circles using graph paper. The sun is included...
Texas Instruments
Exploring Tangents
Explore the concept of tangent lines. In this tangent line lesson plan, learners graph a circle and two lines on their graphing calculator using Cabri Jr. Students construct the lines so that they both intersect at a given point and are...
Curated OER
Excel temperature Graphs
Students gather data about the weather in Nome, Alaska. In this Nome Temperature lesson, students create an excel graph to explore the weather trends in Nome. Students will find the average weather and add a trend line to their graph.
Curated OER
The Numbers Tell the Story
Students demonstrate how to gather and interpret statistical data. In this data analysis instructional activity, students search for statistics on the health effects of smoking and place the information into charts. Students create these...
Curated OER
ELECTRICITY 1
Fifth graders examine the importance of electricity to their everyday lives, practice plotting and interpreting data on a bar graph, and reflect in their journals about how their lives would change without electricity.
Curated OER
Little Boy Blue
First graders read nursery rhymes and celebrate Mother Goose. In this drawing conclusions and predicting lesson, 1st graders create new ending for the nursery rhymes. Students gather data and make a graph showing their favorite rhyme.
Curated OER
Cabri Jr. Inscribed Angles
Young scholars construct inscribed angles using Cabri Jr. They draw a circle on their graphing calculator, then construct an inscribed angle and measure its angle measures. Learners drag the inscribed angle around the circle. They make...
Curated OER
Creating a Graph
Students brainstorm favorite things to do during the summer. They survey classmates to collect data, arrange it in a chart, and create graphs using ClarisWorks.
Curated OER
Evaluating the Products of Chords of a Circle
High schoolers investigate chords and make predictions. In this geometry activity, students graph circles and calculate the measurement of each chord. They perform the calculations and make conjectures.
Curated OER
Circle Relationships
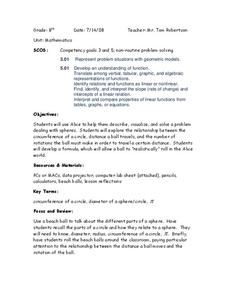
Students explore circles. In this geometry lesson, students explore the relationship between the circumference of a circle, the distance a ball travels, and the number of rotations the ball must make in order to travel a certain...
Curated OER
Reading and Making Pie Graphs
In this pie graphs worksheet, learners solve 10 different problems that include reading a pie graph. First, they use the pie graph to respond to 5 questions that follow. Students determine the year that had the smallest and largest...
Curated OER
Piece of Pie Chart
In this math worksheet, students examine a pie graph which shows a student's homework over 2 hours. Students read the information, then use a pie chart template (divided into 24 parts) to make their own homework chart.
Noyce Foundation
Pizza Crusts
Enough stuffed crust to go around. Pupils calculate the area and perimeter of a variety of pizza shapes, including rectangular and circular. Individuals design rectangular pizzas with a given area to maximize the amount of crust and do...
Bowland
Fruit Pies
Scholars use formulas for the area of a circle and the area of a rectangle to determine the number of pies a baker can make from a particular area of dough. They must also take into account rolling the remaining dough into a new sheet.
Curated OER
Bubble Mania
Elementary schoolers practice measuring a soap bubble print. They follow a recipe to make a soap bubble solution. Pupils use the soapy solution to blow large bubbles with a plastic drinking straw until they pop leaving behind a circular...
EngageNY
Secant and the Co-Functions
Turn your class upside down as they explore the reciprocal functions. Scholars use the unit circle to develop the definition of the secant and cosecant functions. They analyze the domain, range, and end behavior of each function.
EngageNY
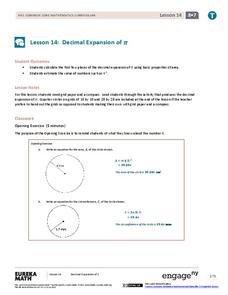
Decimal Expansion of Pi
Develop a better understanding of the value of pi. Learners explore the area of a circle using estimation and graph paper. While continuing to estimate the area of the circle using smaller and smaller grids, the number pi emerges.
EngageNY
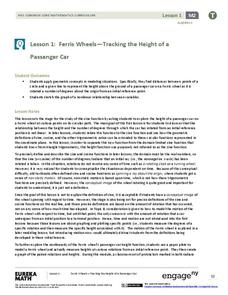
Ferris Wheels—Tracking the Height of a Passenger Car
Watch your pupils go round and round as they explore periodic behavior. Learners graph the height of a Ferris wheel over time. They repeat the process with Ferris wheels of different diameters.
EngageNY
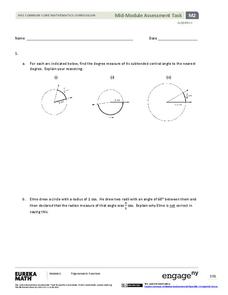
Algebra II Module 2: Mid-Module Assessment
Time for classes to show what they've learned. Use several tasks to assess understanding of the trigonometric functions, unit circle, radians, and basic trigonometric identities.
