Curated OER
Evidence of Change Near the Arctic Circle
Students analyze graphs and make conclusions about climate change. In this climates lesson students produce graphs and identify relationships between parameters.
Curated OER
Students Favorites
Students complete activities using a frequency table and construct a pie graph for the data. In this frequency table lesson, students complete a survey to find data for a frequency table. Students use the given link to make a pie graph...
Curated OER
Data Analysis Challenge
In this data analysis worksheet, young scholars work with a partner to collect information for a survey. The information is then compiled into a graph. Students must indicate their survey question, the target audience, predict the...
Curated OER
Sunshine Math- 2 Earth, VII
In this math worksheet, students solve 8 varied problems that include: making tables, circle graphs, choosing the sign, finding angles in pictures, and estimation.
CPO Science
Physics Skill and Practice Worksheets
Stop wasting energy searching for physics resources, this comprehensive collection of worksheets has you covered. Starting with introductions to the scientific method, dimensional analysis, and graphing data, these skills practice...
Curated OER
Graphing Made Easy
Fourth graders discover the appropriate way to construct and analyze bar, line, picto, and circle graphs. They set up frequency tables and perform some statistical analysis (mean, median, and mode) on their data.
Curated OER
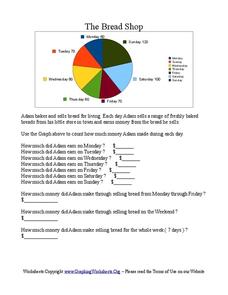
The Bread Shop
In this pie chart worksheet, students use the pie chart graph to count the money Adam made in the Bread Shop. Students complete 10 questions.
Computer Science Unplugged
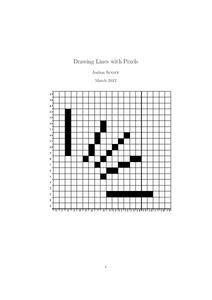
Drawing Lines with Pixels
How do the computers keep it straight? Using the provided algorithms, class members draw a line and a circle using pixels. They then check the drawings using a straight edge and compass to determine the accuracy of their...
Curated OER
"Graph It"
Young scholars work in teams to conduct short surveys of their classmates. They show their results using at least two different types of graphs.
Students separate into teams and are asked that each team to choose something that they are...
Curated OER
Usage and Interpretation of Graphs
Students review graphing and use processing skills to solve problems.
Curated OER
Which Amusement Park Would You Choose?
Students analyze data related to amusement parks and create a spreadsheet to display the data. They read the data and predict which amusement park they think is safer, create a spreadsheet and graph, and write a proposal based on their...
Curated OER
Statistics Problems
In this statistics instructional activity, 3rd graders answer questions about different graphs including bar graphs, picture graphs, line graphs, and more. Students complete 20 multiple choice questions.
Curated OER
Reading Graphs
Students read graphs and charts to interpret results. In this algebra lesson, students interpret bar, line and pictographs. They draw conclusions and make predicitons based on these charts.
Curated OER
Family Activity: Bar Graphs and Line Graphs
In this math learning exercise, students work at home with a family member on a graphing activity. Students count the number of cans, glass jars, boxes and bags in the pantry. Students make a bar and a line graph to represent the data.
Curated OER
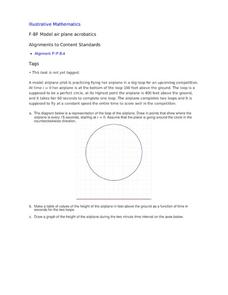
Model Air Plane Acrobatics
Your young airplane enthusiasts will enjoy this collaborative task of graphing an airplane's distance from the ground as it flies in a perfect circle. They will discover that they have graphed a sinusoidal function that comes from the...
Curated OER
Pumpkin Play
Have you ever examined a pumpkin and estimated the number of lines it has? In this math lesson, students count the actual number of lines, record and graph the results. They investigate the circumference, weight and buoyancy of the...
CK-12 Foundation
CK-12 Middle School Math Concepts - Grade 6
Twelve chapters cover a multitude of math concepts found in the Common Core standards for sixth grade. Each title provides a brief explanation of what you will find inside the chapter—concepts from which you can click on and learn more...
Jason Learning
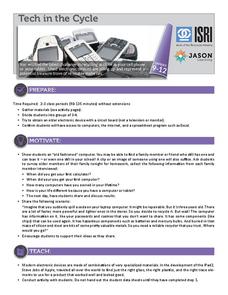
Tech in the Cycle
It might not be easy, but it is worth recycling electronics. Small groups determine the percentage of the materials that make up an iPad 2 and display the information in a circle graph. They then research the recycling process for...
Open Text Book Store
Arithmetic for College Students: Worksheets
Loaded with concepts ranging from multiplying decimals to converting units to solving problems using the order of operations, a thorough practice packet is perfect for a fifth or sixth grade math classroom.
Curated OER
Graphing Parabolas and Circles
Students graph parabolas and circles. In this algebra lesson, students create a table of values and graph the coordinate pairs to create a graph. They graph a circle using the radius and center.
Curated OER
Growing Circles
Pupils identify the equation to represent a circle. In this algebra lesson, students review properties of conics and how they are related. they use a robot to create a visual of circles and their application to the real world.
Curated OER
Solving Inequalities and Graphing
Students solve and graph inequalities on a number line. In this algebra lesson, students solve using addition, subtraction, multiplication and division and graph their solutions using open or closed circles. They graph with 80%-90%...
Curated OER
Moving Out
Young scholars determine their cost of living. For this determining their cost of living lesson, students think of ten necessary things they would need if they moved out of their parents house. Young scholars research the...
Curated OER
The Unit Circle
Students solve problems using the unit circle. For this precalculus lesson, students identify angles using the properties of the unit circle. They observe the trigonometric graphs and sine, cosine and tangent.


