Curated OER
Spreadsheet Graphs
Students create graphs using information from spreadsheets. They select a topic from the following choices: website use, digital cameras, spreadsheets, calculators or educational software. They tally the class results and create an...
Curated OER
Graphs of Formulas
In this worksheet students fill out a function table after reading a short word problem. This is a good way for students to practice the necessary skills for solving word problems or setting up algebra equations.
Curated OER
Problem-Solving Application: Use a Graph
In this problem solving worksheet, 6th graders use the problem solving steps of understand, plan, solve and look back to answer a graphing question.
Curated OER
Pictures of Data: Post Test
In this data worksheet, students answer multiple choice questions about charts and graphs. Students answer 10 questions total.
Curated OER
Dynamite Data
Second graders rotate through a variety of stations designed to offer practice in manipulating data. They sort, tally and count items and then create bar graphs, tables, and pie graphs to record their findings.
Curated OER
Finding PI
Students select and use appropriate operations, methods and tools to compute or estimate using whole numbers. They develop and use formulas for determining the circumference and area of circles. Students determine and describe the...
Curated OER
Pictures of Data
In this data worksheet, students look at maps and charts and answer multiple choice questions about them. Students complete 10 questions.
Curated OER
Graphing Favorite Holidays
Students create spreadsheets and bar graphs based on results of survey of favorite holidays.
Curated OER
Is there Treasure in Trash?
More people, more garbage! Young environmentalists graph population growth against the amount of garbage generated per year and find a linear model that best fits the data. This is an older resource that could benefit from more recent...
Curated OER
WebQuest: Thrills and Spills- Pick Your Park!
Students participate in a WebQuest in which they must determine which amusement park is the "median priced" park. Students visit park websites to accumulate prices for parking, activities, restaurants, and gift shops.
Curated OER
Trees
Students investigate the parts of a tree, measure its circumference and the length and width of its longest branch. The data is compiled and placed into a bar graph.
Curated OER
Tree Measurement
Measure a tree? Yes, measure a tree! Students get outside and measure a tree's trunk, crown, and height. Each group compares their answers to determine if any re-measuring is necessary. Once back in the classroom, students make bar...
Curated OER
Grids
This fun presentation includes instructions for a grid game, where the child must follow directions to uncover the hidden treasure. They make Mr. Smiley move up, down, right, and left on the grid until he's reached the...
Mathematics Assessment Project
Ice Cream
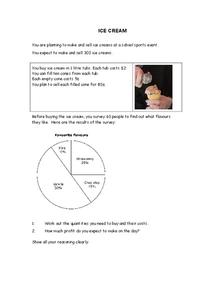
I scream, you scream, we all determine the amount of ice cream! Pupils calculate the amount of ice cream flavors needed based on survey results in a short summative assessment. They determine the number of tubs and cost of ice...
Curated OER
Grade 5 Social Studies Booklet 1
In this grade 5 social studies booklet 1 worksheet, 5th graders answer 35 multiple choice questions and 10 short answer question in standardized test format.
Curated OER
Let's Graph It
In this let's graph it worksheet, student interactively answer 10 multiple choice questions about graphing data and types of graphs, then click to check their answers.
Curated OER
Getting A Grip On Graphs
Fourth graders investigate the concept of graphing and comparing different types of data using pictographs, line graphs, scatter plots, etc... They gather data and make interpretations while examining the medium of how it is displayed.
Curated OER
Algebra 2 Test
In this algebra learning exercise, students solve problems involving functions, systems and conics. They simplify radicals and graph parabolas identifying the focus and ellipse. There are 20 questions.
Curated OER
Creating Line Graphs
High schoolers draw line graphs. In this math lesson, students interpret minimum wage data and graph the data in a line graph. High schoolers predict the next minimum wage and figure the earnings for a 40 hour work week for someone...
Curated OER
Fit With Fiber
Sixth graders investigate the nutritional value of different types of cereal. They take a survey of students that ate breakfast and create a circle graph with the results. Students examine the nutritional information on the sides of the...
Curated OER
Meatiest States: Graph Problem Solving
In this graph problem solving learning exercise, students analyze a graph that shows commercial red meat production in five states. Students answer 5 word problems using the data on the graph.
Special Olympics
Special Olympics Volleyball Coaching Guide: Teaching Volleyball Skills
From warm-up routines and stretches to skill progressions and passing drills, this is an absolute must-have resource for coaches teaching volleyball to a group of learners with diverse needs and skills.
Curated OER
Circle Art
Students investigate two and three dimensional shapes. In this geometry lesson, students write equations of circles and graph them correctly. They create pictures using circles.
Curated OER
What Pie?
Students practice making and interpreting pie graphs so they are better able to decide if a pie chart is the appropriate form of display. Students examine included overheads of different pie charts, and directions on how to make pie...


