Curated OER
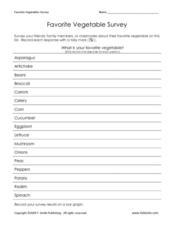
Favorite Vegetable Survey
What's your favorite? Use this chart template in your lesson on data collection and graphing. Learners record classmates' favorite vegetable in a survey, and then graph the results. A labelled graph is provided here- print both pages...
Curated OER
SkittleGraphs
Second graders discover how to make a bar graph. Each student receives a bag of Skittles candy. They make a bar graph which documents the colors found in the bag. At the end of the lesson, the Skittles are eaten. Fun!
Curated OER
Ice Cream Scoop
In this data display worksheet, students write 6 flavors of ice cream on pieces of paper. Students choose papers one at a time and keep track on a tally sheet. Students make a bar graph of the results.
Curated OER
Temperature
Students explore the concept of temperature. For this temperature lesson, students read thermometers in degrees Celsius. Students discuss the temperature of the seasons and what clothing they might wear given a certain temperature....
Curated OER
Lucky Charms Sort
Students make a bar graph. In this sorting and counting lesson, students use the Lucky Charms cereal to sort the marshmallows into separte cups, count how many marshmallows are in each cup and make a bar graph to compare the numbers.
Curated OER
Science: Teddy Bear Nation
Students sort teddy bears according to types and then graph the results. They each bring a bear to class and then discuss their similarities and differences. Once the bears have been sorted into groups according to size and color,...
Balanced Assessment
Cost of Living
Math scholars investigate the cost of living in Hong Kong compared to Chicago but must first convert the different types of currency. They then choose a type of graph to compare different spending categories and finish the activity by...
Curated OER
Level III: Technology Integration
Fourth graders prepare two spreadsheets each with an embedded line graph that displays data about the growth of the bitter rot fungus on apples and on petri dishes that were stored in the refrigerator and the classroom. They prepare a...
Curated OER
Creating Bar Graphs
Fifth graders design and label a bar graph using data taken from a class survey. They observe a teacher-led lecture, write and conduct their survey, and create a bar graph that includes identification of the minimum, maximum, mode,...
Curated OER
Interpreting Graphs and Analyzing Data
Students investigate graphs and analyze the data displayed in the graph. They read a graph reflecting the birthday data for the students to read and analyze. Students use the graph to determine the number of birthday cards they need to...
Curated OER
Voting and Elections: Vote to Make a Difference
Learners use a ballot to make a choice about two items to vote on. In this voting lesson plan, students discuss comparing choices between two items, the benefits and drawbacks to each, and make tally marks to total the votes.
Curated OER
Generate Measurement Data Word Problems
Using a set of simple data, learners create a line plot to organize the information. This data includes only single-digit numbers and the highest number is six. Because the answer is explained and illustrated at the bottom, project this...
Curated OER
Generate Measurement Data Word Problems
Plot data for three word problems, each with a table of data. Learners create line plots for these, all of which have only single-digit whole numbers. The large text and few number of problems make this ideal as a whole-class warm up....
Curated OER
kind of Bean
Third graders sort different types of beans and collect the data. They create a data table, put the information on the data table and then graph their results. They answer follow-up questions.
California Education Partners
Colorful Data
Scale up your lessons with a performance task. Young data analysts work through an assessment task on scaled bar graphs. They answer questions about a given scaled bar graph on favorite colors, analyze a bar graph to see if it matches...
Curated OER
Twelve Days of Christmas--Prediction, Estimation, Addition, Table and Chart
Scholars explore graphing. They will listen to and sing "The Twelve Days of Christmas" and estimate how many gifts were mentioned in the song. Then complete a data chart representing each gift given in the song. They also construct...
National Security Agency
Line Plots: Frogs in Flight
Have a hopping good time teaching your class how to collect and graph data with this fun activity-based lesson series. Using the provided data taken from a frog jumping contest, children first work together...
Noyce Foundation
Granny’s Balloon Trip
Take flight with a fun activity focused on graphing data on a coordinate plane. As learners study the data for Granny's hot-air balloon trip, including the time of day and the distance of the balloon from the ground, they practice...
BW Walch
Solving Systems of Linear Equations
Solving systems of equations underpins much of advanced algebra, especially linear algebra. Developing an intuition for the kinds and descriptions of solutions is key for success in those later courses. This intuition is exactly what...
Curated OER
Pictograph to Bar Graph
Second graders explore organizing data to make it useful for interpreting picture graphs and bar graphs. They use Graphers software to create a pictograph and a bar graph.
Curated OER
Introduction to Bar Graphs Lesson Plan
Students organize and interpret data using bar graphs.
Curated OER
Bar Graphs
Third graders examine the main parts of a bar graph and how to round up to the nearest tenth. They make an example of a bar graph and answer questions based on the graph using a list of state capitals and their average temperatures....
Curated OER
Fast Food Survey Using Bar Graphs
Second graders conduct survey and sort data according to categories, construct bar graph with intervals of 1, and write a few sentences about their graphs.
Curated OER
Family Activity: Bar Graphs and Line Graphs
In this math learning exercise, students work at home with a family member on a graphing activity. Students count the number of cans, glass jars, boxes and bags in the pantry. Students make a bar and a line graph to represent the data.


