Curated OER
Use a Graph
Information is often presented in graph form. Can your youngsters read a basic bar or picture graph? Six word problems accompany three graphs. One graph is a bar graph and the other two are pictographs.
Curated OER
Choose a Graph to Display Data
In this math graphs worksheet, students write line plot, tally chart, pictograph, or bar graph to tell the best kind of graph to use to answer the six questions.
Curated OER
Graphing
Intended for a faith-based classroom, this lesson requires second graders to create a survey, conduct the survey in multiple classrooms, and graph the results. They can choose between creating a picture or bar graph, or you can require...
Alabama Learning Exchange
I Know What You Did Last Summer: A Data Graphing Project
Young scholars participate in graphing data. In this graphing data lesson, students make a stem and leaf plot of their summer activities. Young scholars create numerous graphs on poster boards. Students discuss the...
Curated OER
Making a Bar Graph
In this bar graph worksheet, students analyze a data table and bar graph depicting information about stickers collected. Students answer 5 questions about the data displayed.
Curated OER
Activity: Make a Bar Graph
In this bar graph worksheet, students use a given picture to create a graph, then use the graph to solve 2 related problems. Graph is sports related.
Curated OER
Survey of Height
In this data collection instructional activity, students survey the heights of their fellow classmates, organize their data in a data table, and create a bar graph from their data. Once bar graph is completed, students complete 2 short...
Curated OER
What's in a Graph?
How many yellow Skittles® come in a fun-size package? Use candy color data to construct a bar graph and a pie chart. Pupils analyze bar graphs of real-life data on the Texas and Massachusetts populations. As an assessment at the end...
Kid Zone
Groundhog's Day Graphing
This Groundhog's Day, challenge scholars to predict, estimate, tally, and graph in a weather-themed lesson in which class members play the role of the groundhog to forecast the weather come February second.
Curated OER
Cutting Expenses
Learners explore budgeting. In this finance and math lesson, students brainstorm ways in which households could save money. Learners view websites that give cost reducing ideas. Students complete an expense comparison chart and use the...
Curated OER
Sand Babies
An engaging lesson which has elementary learners measure weight to the nearest pound and construct and interpret a bar graph! They measure length using non-standard units and determine area using square tiles. Pupils round their birth...
Curated OER
Iron For Breakfast
Third graders are challenged to use scientific thinking, they experiment and observe which objects are attracted to a magnet. Pupils use the evidence to construct an explanation as to what common property the objects attracted to a...
Berkshire Museum
Reduce, Reuse, and Recycle: Sorting Through Personal Choices
Raise children's awareness about the importance of conservation with this hands-on science activity. Start by breaking the class into groups and having them collect trash from around the school or local park. Learners then use the...
Curated OER
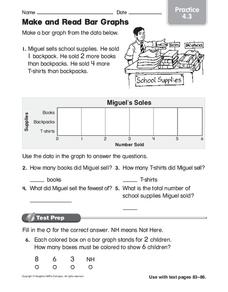
Make and Read Bar Graphs
For this bar graphs worksheet, students make a bar graph about the sale of school supplies with the data presented in one story problem.
Texas Instruments
Data Collection for Bar Graphs
Learners study the concept of central tendency in this data collection for bar graph lesson. They collect data outside as instructed and organize it into a bar graphs, then they list in specific groups the labels that appear on the...
Curated OER
Bar Graph Lesson
Students make a bar graph. In this graphing lesson, students discuss why bar graphs are used and are shown bar graph examples. Students create their own bar graph to compare the heights of different things around the world. Students...
Curated OER
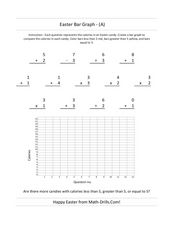
Easter Bar Graph- A
In this Easter math worksheet, students first solve 13 problems with addition, subtraction, multiplication and division. Using the answers, students make a bar graph.
Curated OER
Rubber Band Banza
Third graders review ideas about sound and vibration to make their own stringed instrument. They review what a pictograph and bar graph are. Pupils conduct a survey within the classroom to choose the four favorite string instruments and...
Curated OER
Physical Science: Festival of Bubbles
Investigate bubbles through the use of scientific inquiry. Pupils blow bubbles using several methods and measure the resulting bubble print. Measurements are recorded on a data table and transferred to a bar graph. Results are discussed...
Curated OER
Call it "Macaroni"
Who knew there were so many fun educational opportunities featuring pasta? Scholars read a brief informational text about the history of pasta (note that "macaroni" is spelled two different ways, so address this if kids are reading...
Curated OER
Drive the Data Derby
Three days of race car design and driving through the classroom while guessing probability could be a third graders dream. Learn to record car speed, distances traveled, and statistics by using calculation ranges using the mean, median,...
National Security Agency
Going Green with Graphs
In this unit designed for second graders, youngsters are introduced to conducting surveys and creating tally charts based on the data they gather. Students then construct bar graphs, and observe the relationships between the two...
Curated OER
Probability and Statistics
Elementary schoolers choose from a host of activities to investigate probability and statistics. They complete worksheets, create 3-D graphs, and play graph bingo. They make weather predictions and list all the possibilities before going...
Baylor College
Water: The Math Link
Make a splash with a math skills resource! Starring characters from the children's story Mystery of the Muddled Marsh, several worksheets create interdisciplinary connections between science, language arts, and math. They...


