Scholastic
Study Jams! Line Plots
Data analysts are guided through the arrangement of whole-number data onto a line plot by listening and viewing a high-quality, animated, and narrated set of slides.
Scholastic
Study Jams! Choosing the Correct Graph
With so many types of graphs, don't let your learners get stuck figuring out which one to use. To track how Zoe spent her allowance, use this interactive lesson to review all the types of graphs and pick the best one to display the data....
Physics Classroom
Using Graphs
Many university professors complain incoming scholars struggle with interpreting graphs. A skill builder offers three different types of exercises including calculating slope, interpreting graphs, and extrapolating outside the plotted...
CK-12 Foundation
Line Graphs to Display Data Over Time: Strawberry Competition
Take the tediousness out of graphing. Using the interactive tool, learners can efficiently create a line graph from a set of data. They then use the graph to answer questions about specific trends in the data.
CK-12 Foundation
Understand and Create Line Graphs: Line Graphs
Explore line graphs and their characteristics through an interactive lesson. Scholars follow a set of directions to plot data on a line graph. They then answer questions about the type of variables, minimum and maximum values, and...
CK-12 Foundation
Graphs in the Coordinate Plane: Functions on a Cartesian Plane
Connect the dots to graph a linear function. Young mathematicians use an interactive to first plot provided points on a coordinate plane. They connect these points with a line and then answer questions about the slope and y-intercept of...
Shodor Education Foundation
Data Flyer
Fit functions to data by using an interactive app. Individuals plot a scatter plot and then fit lines of best fit and regression curves to the data. The use of an app gives learners the opportunity to try out different functions to see...
National Council of Teachers of Mathematics
Geogebra: Residuals and Linear Regression
If the line fits, use it. Using a Geogebra interactive, pupils plot points and try to find the best fit line. They assess the linear fit by analyzing residuals. A radio button allows participants to show the regression line and the...
Shodor Education Foundation
Regression
How good is the fit? Using an interactive, classmates create a scatter plot of bivariate data and fit their own lines of best fit. The applet allows pupils to display the regression line along with the correlation coefficient. As a final...
Curated OER
Statistical Calculations Using M&Ms
In this frequency worksheet, students investigate, frequency, box plots, and percentage using a package of M&Ms. Copies of the actual correspondences with the Mars company are also included.
Curated OER
Graph Made Easy: Post Test
In this graphs worksheet, students answer multiple choice questions about line graphs and bar graphs. Students answer 10 questions total.
CK-12 Foundation
Graphs for Discrete and for Continuous Data: Discrete vs. Continuous Data
Not all data is the same. Using the interactive, pupils compare data represented in two different ways. The learners develop an understanding of the difference between discrete and continuous data and the different ways to represent each...
CK-12 Foundation
Determining the Equation of a Line: Temperature Conversion Challenge
Line up the temperature conversions. Pupils create the linear function between Celsius and Fahrenheit on a graph by plotting the freezing and boiling points of water. The scholars determine how the relationship changes based upon...
GeoGebra
All For One, One For All
Will someone please constrain those pets? Pupils create two constraint equations on the number of cats and dogs for a pet sitter. They choose specific points and determine whether the point satisfies one or both constraints. The...
Chemistry Collective
Virtual Lab: Determination of the pH Scale by the Method of Successive Dilutions
Where did the pH scale come from? Take a deeper look at a most important measure of ion concentration using a simulated physical determination. Young chemists prepare a series of dilutions after determining a dilution factor for the...
Curated OER
Simultaneous Equations for Circuit Analysis
In this learning exercise, learners use Algebra to plot different solutions to equations and analyze schematics in order to answer a series of 25 open-ended questions about electrical circuits. This learning exercise is printable and the...
Curated OER
Graph Made Easy-Pre Test Questions
In this graphing pre test instructional activity, students complete a set of 10 multiple choice questions. Page is labeled as a pretest, an answer link is provided.
Curated OER
Moving Straight Ahead
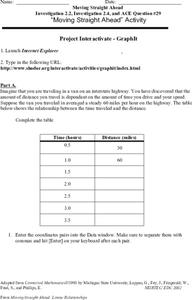
In this functions worksheet, 9th graders solve and complete 24 various types of problems. First, they complete the table with the correct distance for each hour given. Then, students enter the coordinate pairs into the function table...
Curated OER
Coordinate Plane
In this algebra worksheet, students investigate the coordinate plane through graphing, plotting and identifying the different quadrants. They identify vertical and horizontal lines in the coordinate plane. There are 10 questions with an...
Curated OER
AC Phase
In this AC phase learning exercise, students answer 24 questions about AC and DC voltages, phasor diagrams, sine wave graphs and Lissajous figures.
Curated OER
Chart problems involving car defects and customer service departments
In this interactive worksheet, students solve two problems using the charts provided. Students must convey they are able to understand charts and how to read them.
Annenberg Foundation
Annenberg Learner: Making a Stem and Leaf Plot
A line plot may not be a useful graph for investigating variation so we must come up with a new representation based on groups of data. Construct a stem and leaf plot from a set of 26 data values.
BBC
Bb Ci: Exponential Graphs (Higher)
Exponential graphs increase rapidly in the Y direction and will never fall below the X -axis, thus forming a curve.
National Council of Teachers of Mathematics
Nctm: Illuminations: Line of Best Fit
Use this activity to practice how to enter a set of data, plot the data on a coordinate grid, and determine the equation for a line of best fit.


