EngageNY
Interpreting Residuals from a Line
What does an animal's gestation period have to do with its longevity? Use residuals to determine the prediction errors based upon a least-square regression line. This second lesson on residuals shows how to use residuals to create a...
Curated OER
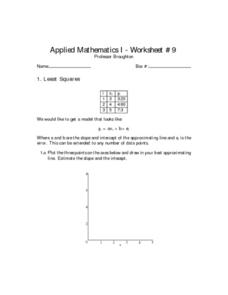
Least Squares
In this least squares worksheet, students solve 6 different problems that include the least squares of numbers. First, they plot 3 points on the axes shown and draw in their best approximating line. Then, students estimate the slope and...
Virginia Department of Education
Line of Best Fit
Pupils work through a guided activity on fitting a linear equation to a set of data by entering the data into a calculator and trying to envision a line of best fit. They then have the calculator determine the least-squares line and...
CK-12 Foundation
Least-Squares Regression
Residual plots let you find the perfect line of best fit. As users adjust the points on a scatter plot and a possible line of best fit, the interactive automatically changes the residual plot. This change allows them to see connections...
Curated OER
Least Squares Fit Line
Practice makes perfect! Learners estimate the least squares fit line for a set of data. They understand error involved in least squares fit lines, and solve application problems using least square fit lines.
Curated OER
Linear Systems: Least Squares Approximations
In this least squares approximation activity, students determine the number of solutions a given linear system has. They find the least square error and the equation of a line of best fit for a set of three points. Students find the...
PHET
Least-Squares Regression
Less is best when looking at residuals. Scholars use an interactive to informally fit a linear regression line to data on a scatter plot. The interactive provides a correct best fit line with residuals and correlation coefficient to...
EngageNY
Modeling Relationships with a Line
What linear equation will fit this data, and how close is it? Through discussion and partner work, young mathematicians learn the procedure to determine a regression line in order to make predictions from the data.
Curated OER
Influence and Outliers
Using the TI-Nspire calculator, statisicians identify outliers and their effect on the least-squares regression line. In finding the line of best fit, they determine what points will affect the least squares regressions and what points...
EngageNY
More on Modeling Relationships with a Line
How do you create a residual plot? Work as a class and in small groups through the activity in order to learn how to build a residual plot. The activity builds upon previous learning on calculating residuals and serves as a precursor to...
Curated OER
Linear Systems: Least Squares Approximations
In this least squares approximation worksheet, students use linear algebra to find the least square error and the equation of a line for given points. They find the equation of a parabola through provided points. This four-page...
Curated OER
Numerical Analysis: Discrete Least Squares
In this discrete least squares worksheet, students use a linear algebra approach to discrete last squares approximation. This two-page worksheet contains approximately 10 problems.
Kenan Fellows
Least Squares Linear Regression in R
The task? Determine the how effective hospitals are at reducing the rate of hospital-acquired infections. The method? Data analysis! Using an open source software program, individuals use provided data and create scatterplots to look for...
Kenan Fellows
Multivariate Least Squares Regression Model with Variable Selection
The risk of contracting an infection in the hospital is low, but it does happen. Learn what risk factors have the highest correlation with hospital-acquired infections in the final lesson of a three-part series. Using the open source R...
EngageNY
Analyzing Residuals (Part 1)
Just how far off is the least squares line? Using a graphing calculator, individuals or pairs create residual plots in order to determine how well a best fit line models data. Three examples walk through the calculator procedure of...
Curated OER
4-H Line & Design Activity Page
What a great activity for students. This 4-H activity sheet has students organize their bedroom, and make clothing, focusing on line and design.
Curated OER
Least Squares Fit Line
Pupils estimate the least squares fit line for a set of data. They understand error involved in least square fit lines. They solve application problems using least square fit lines.
Curated OER
Coffee and Crime
Is there a correlation between the number of coffee shops and the amount of crime in a given area? In this quick exercise, your class will examine the data, interpret the results, and discuss their conclusion. Concepts covered include...
Curated OER
Review of Pre-Algebra
Middle and high schoolers review topics covered Pre-Algebra. They solve problems questions dealing with exponents, square roots and absolute value. They use the rules of divisibility and identify prime numbers. This two-page on-line...
College Board
2018 AP® Statistics Free-Response Questions
Are your classes ready for their final exams? Give them a test run with the 2018 AP® exam. The resource provides the six free-response questions covering topics such as confidence intervals, population proportions, and least-squares...
Curated OER
Orchid in Blind Contour Format
Students create blind contour drawings. They compare methods of drawing including blind contour and contour approaches. Students follow a blind contour method to produce a drawing of a flower and then complete the piece with a watercolor...
Curated OER
The Number Line
Eighth graders investigate the order of numbers and how they are located on the number line. They also review the symbols used to compare quantities in order to decipher simple expressions and graph them on the numberline.
Curated OER
Line and Double Line Graphs: Practice
In this graphing data worksheet, students use the double line graph to answer the five questions about high and low temperatures. Students then complete two test prep questions.
Charleston School District
Comparing and Ordering Irrational Numbers on a Number Line
Estimating the value of numbers is much harder than it sounds! Scholars compare and order the value of numbers presented in different forms including fractions, decimals, roots, integers, and pi. This builds on the previous lessons in...


