Helping with Math
Division: Four Digit by One Digit
Lengthen learners' long division skills with this single-page handout. They must use problem solving skills to find the quotient when a four-digit number is divided by one digit. This is a nice assignment for early in the process of...
Curated OER
Scatter Graphs
In this scatter graphs worksheet, students learn a way of illustrating information about two related values. Students complete 30 questions about the graphs. Note: One of the graphs has English pounds. This is intended as an online...
Curated OER
Representing Numbers to 50
In this mathematics worksheet, 1st graders identify two-digit numbers that show tens and ones. Then they write how many tens and ones there are and place the number in the boxes given.
Curated OER
Subtraction Decimals
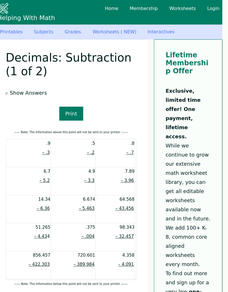
In this math worksheet, learners subtract the decimals while taking special care to keep the decimals in the correct place value. The answers are also available.
Federal Reserve Bank
Important Financial Documents
Emergencies usually come by surprise — preparation is key. Help to reduce anxiety of the unknown by having a financial plan in place for when they arise. Important documents are gathered and action plans are documented.
Federal Reserve Bank
Financial Goals
Do you have financial goals? How will you make them happen? Help your pupils answer these questions through this interactive project. They create goals and a plan for reaching them as one of many high school algebra projects.
Curated OER
Addition Decimal Thousandths
In this decimal addition activity, students use addition to solve the decimal equations that range to the thousandths place. Students solve 15 problems.
Curated OER
Graphs
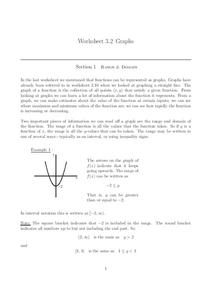
In this graphs worksheet, students solve and complete 15 various types of problems. First, they determine the range of the function of the graph shown and write in interval notation. Then, students find the domain of the function in the...
Curated OER
Finding out about Gallery 33
While these worksheets are specific for use while visiting the Birmingham Museum and Art Gallery, they could be used to guide nearly any museum trip. Questions focus on human activity, symbolism, culture, religion, and society as they...
Lane Community College
Review Sheets: Basic Mathematics 2
A good mix of Pre-Algebra problems, learners tackle everything from proportions and equations, to polygons and circles. The sections are broken up by topic with a list of the skills that are required to complete the questions.
EngageNY
Solutions of a Linear Equation
Use the distributive property to solve equations. The sixth lesson in a 33-part series has scholars solve equations that need to be transformed into simpler equations first. Class members apply the distributive property to the equations...
Virginia Department of Education
Analyzing and Interpreting Statistics
Use measures of variance to compare and analyze data sets. Pupils match histograms of data sets to their respective statistical measures. They then use calculated statistics to further analyze groups of data and use the results to make...
Curated OER
Systems of Equations and Inequalities
This is a comprehensive lesson on creating and solving equations and systems of equations and inequalities. Problems range from basic linear equations to more complex systems of equations and inequalities based on a real-world examples....
EngageNY
Measuring Variability for Skewed Distributions (Interquartile Range)
Should the standard deviation be used for all distributions? Pupils know that the median is a better description of the center for skewed distributions; therefore, they will need a variability measure about the median for those...
EngageNY
Modeling from a Sequence
Building upon previous knowledge of sequences, collaborative pairs analyze sequences to determine the type and to make predictions of future terms. The exercises build through arithmetic and geometric sequences before introducing...
EngageNY
Analyzing Residuals (Part 1)
Just how far off is the least squares line? Using a graphing calculator, individuals or pairs create residual plots in order to determine how well a best fit line models data. Three examples walk through the calculator procedure of...
EngageNY
Analyzing a Data Set
Through discussions and journaling, classmates determine methods to associate types of functions with data presented in a table. Small groups then work with examples and exercises to refine their methods and find functions that work to...
EngageNY
Random Sampling
Sample pennies to gain an understanding of their ages. The 16th installment of a 25-part series requires groups to collect samples from a jar of pennies. Pupils compare the distribution of their samples with the distribution of the...
Teach Engineering
Can You Resist This?
Some things are hard to resist. Small collaborative groups build circuits and calculate the voltage using Ohm's Law. Budding engineers explore the connection between the voltage across different resistors and linear functions with...
West Contra Costa Unified School District
Correlation and Line of Best Fit
Computers are useful for more than just surfing the Internet. Pupils first investigate scatter plots and estimate correlation coefficients. Next, they use Microsoft Excel to create scatter plots and determine correlation coefficients and...
Teach Engineering
Slinkies as Solenoids
What does an MRI machine have to do with a slinky? This activity challenges learners to run a current through a slinky and use a magnetic field sensor to measure the magnetic field. Groups then change the length of the slinky to see the...
EngageNY
Understanding Box Plots
Scholars apply the concepts of box plots and dot plots to summarize and describe data distributions. They use the data displays to compare sets of data and determine numerical summaries.
EngageNY
Connecting Graphical Representations and Numerical Summaries
Which graph belongs to which summary statistics? Class members build upon their knowledge of data displays and numerical summaries to connect the two. Pupils make connections between different graphical displays of the same data in the...
EngageNY
Base 10 and Scientific Notation
Use a resource on which you can base your lesson on base 10 and scientific notation. The second installment of a 35-part module presents scholars with a review of scientific notation. After getting comfortable with scientific notation,...


