Code.org
Cleaning Data
"Clean the data!" "I did not know it was dirty." Introduce your class to the process of cleaning data so that it can analyze it. Groups work through a guide that demonstrates the common ways to filter and sort data. Pairs then...
Polar Trec
How Much Data is Enough?
The next time you read a magazine or watch the news, make note of how many graphs you see because they are everywhere! Here, scholars collect, enter, and graph data using computers. The graphs are then analyzed to aid in discussion of...
Bonneville
Solar Panel Data Sharing
It's important to share—especially in science. Pupils share the data on voltage, current, and resistance they recorded when they built circuits with solar cells in a previous lesson. They discuss the results with the class and consider...
Curated OER
Data Analysis
Young statisticians use and interpret measures of center and spread such as mean, median, and mode as well as range. They use box plots to represent their data and answer questions regarding the correspondence between data sets and the...
Curated OER
Applied Science - Science and Math Lab 4B
Learners experiment with the combination of vinegar and baking soda. In this applied science lesson, future scientists compare qualitative and quantitative data collected from their exploration. Then they work together to analyze and...
Statistics Education Web
Are Female Hurricanes Deadlier than Male Hurricanes?
The battle of the sexes? Scholars first examine data on hurricane-related deaths and create graphical displays. They then use the data and displays to consider whether hurricanes with female names result in more deaths than hurricanes...
Teach Engineering
Communicating Your Results
Groups analyze and interpret their data from previous research in order to develop individualized findings. The teams then use guidelines to help determine what aspects of their research to include on a poster. Class members then compare...
Howard Hughes Medical Institute
Lactase Persistence: Evidence for Selection
What's the link between lactase persistence and dairy farming? Biology scholars analyze data to find evidence of the connection, then relate this to human adaptation. Working individually and in small groups, learners view short video...
Curated OER
Interpreting Data and Building Hypothesis
Students define the term species, and graph species data together with previously collected data at the National Zoo. They interpret graphed data and recognize patterns in the streamside quadrant versus hillside quadrant. Students use...
Curated OER
Interpreting Data, Facts and Ideas from Informational Texts - A Different King of Fuel
Why do we need renewable energy resources? Discuss the energy crisis with your middle and high school classes through interpreting informational texts. An engaging video and a worksheet accompany this plan.
Space Awareness
A View From Above
Analyzing and interpreting satellite data takes knowledge and patience. Through a detailed lab investigation, young scholars learn the process of analyzing this data. They use technology to create color images and maps from real...
Curated OER
Ornithology and Real World Science
Double click that mouse because you just found an amazing lesson plan! This cross-curricular Ornithology lesson plan incorporates literature, writing, reading informational text, data collection, scientific inquiry, Internet research,...
California Academy of Science
California's Climate
The United States is a large country with many different climates. Graph and analyze temperature and rainfall data for Sacramento and Washington DC as you teach your class about the characteristics of Mediterranean climates. Discuss the...
Chicago Botanic Garden
Historical Climate Cycles
What better way to make predictions about future weather and climate patterns than with actual climate data from the past? Young climatologists analyze data from 400,000 to 10,000 years ago to determine if climate has changed over time....
Curated OER
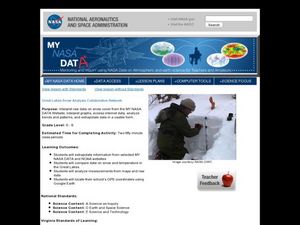
Great Lakes Snow Analysis Collaborative Network
Learners interpret data on snow cover and analyze trend patterns. In this snow instructional activity students compare data and locate their school's GPS coordinates.
Curated OER
Environmental Agents of Mathematics: Mathematics for Change
High schoolers analyze environmental science data using Math. They do research about renewable energy, gather data, create graphs and interpret their findings. Then the group presents their arguments persuasively using their findings to...
Curated OER
Data, Data, Everywhere... and What Am I To Think?
Students demonstrate good random sampling techniques for data collection, select and develop graphic presentations of data and analyze the data to solve a problem presented.
NASA
A Different Perspective
What can we learn from the data? Young scholars analyze actual solar data to answer specific questions. The activity presents an opportunity for an open-ended investigation of the data to conclude a five-part series on solar winds.
Howard Hughes Medical Institute
Got Lactase? Blood Glucose Data Analysis
Many physicals include a blood glucose test, but what are doctors actually testing? Scholars graph and interpret blood glucose data, allowing them to observe the differences in lactase persistence and draw conclusions. They then connect...
National Wildlife Federation
Wherefore Art Thou, Albedo?
In the sixth lesson in a series of 21, scholars use NASA data to graph and interpret albedo seasonally and over the course of multiple years. This allows learners to compare albedo trends to changes in sea ice with connections to the...
ARKive
Handling Data: African Animal Maths
Handling and processing data is a big part of what real scientists do. Provide a way for your learners to explore graphs and data related to the animals that live on the African savannah. They begin their analysis by discussing what they...
Office of the New Jersey State Climatologist
Play Ball! – Or Not…Making a Decision Using Weather Data
Should the game go on or not? An engaging lesson asks small groups to make a decision using weather data. After analyzing a map, an updated forecast, and radar information, groups have to decide whether to cancel a baseball game. They...
Consortium for Ocean Leadership
Nannofossils Reveal Seafloor Spreading Truth
Spread the word about seafloor spreading! Junior geologists prove Albert Wegener right in an activity that combines data analysis and deep ocean exploration. Learners analyze and graph fossil sample data taken from sites along the...
Curated OER
Sending Messages to Space
Students interpret a message sent to space using a radio telescope and draw inferences from the interpreted message. Working with a partner, they interpret data that scientists believe is a message from aliens. They work on organizing...


