Curated OER
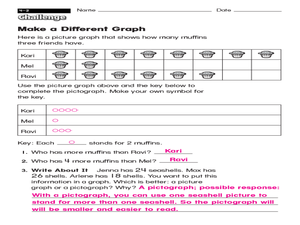
Make a Different Graph
What is the difference between a picture graph and a pictograph? Young learners are given a picture graph detailing how many muffins three friends have, and they must complete a pictograph using a symbol of their choice. An answer key is...
Virginia Department of Education
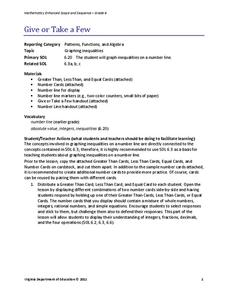
Give or Take a Few
Young mathematicians extend their knowledge of rational numbers on a number line to graph inequalities by first using number cards to compare rational numbers. They finish by using similar reasoning to graph inequalities on a number line.
Curated OER
Linear Programming
Learners explore inequalities to determine the optimal solution to maximize a profit for a company. In this linear programming lesson, students discover how to graph inequalities and how to determine the algebraic representation of a...
Curated OER
Linear Programming
In this algebra worksheet, students calculate the maximum and minimum of a shaded region. They identify the boundaries and their vertices's. There are 2 problems.
Curated OER
Survey Says...
Young statisticians collect, organize, and present data to illustrate responses to a survey question. They write and conduct the survey. They finish by presenting the results in the form of a graph.
Wisconsin Online Resource Center
Oversized Inch
Each member of the class creates their own paper ruler. Using their ruler, kids walk around the room measuring the objects you've specified. Discuss how items should be measured to the 16th of an inch, the smallest unit on their ruler....
Curated OER
Barbie Bungee
Middle and high schoolers collect and analyze their data. In this statistics lesson, pupils analyze graphs for linear regression as they discuss the relationship of the function to the number of rubber bands and the distance of the...
Curated OER
Investigating Parabolas
For this investigating parabolas worksheet, 9th graders solve and graph 7 different problems that include graphing various equations that represent parabolas. First, they sketch their graphs to each problem. Then, students determine what...
Curated OER
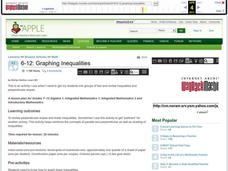
Graphing Inequalities
Students graph linear equations and then find the person in class whose linear equation graph is perpendicular to theirs. In this graphing inequalities lesson plan, students graph their perpendicular slopes and then once their find their...
Curated OER
Solving Linear Inequalities
Walk the class through the steps of how to evaluate linear inequalities in one variable and graph the solution set. Define and discuss key vocabulary terms, then have individuals work problems of varying difficulty. Included are word...
EngageNY
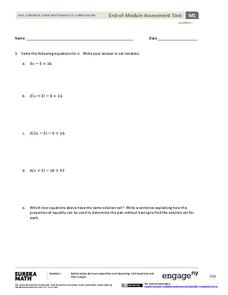
End-of-Module Assessment Task - Algebra 1 (Module 1)
What do your young geniuses really know? Assess the procedural knowledge of your pupils at the same time as their higher-level thinking with an assessment that identifies their depth of knowledge. Topics include solving...
Curated OER
Quick Graphs of Linear Equations
Graph equations of lines using the slope-intercept method or by plotting both x and y intercepts. Determine if two lines are parallel or perpendicular by comparing their slopes. This handout includes step-by-step directions and four...
Curated OER
Graphing Linear Equations on the TI-73
Eighth graders work in pairs with a TI-73 graphing calculator to complete a multiple-choice review using the Classroom Performance System. Each team uses a remote unit to "click in" the answers. When all teams have completed the review,...
Concord Consortium
Gestation and Longevity
Is the gestation length of an animal a predictor of the average life expectancy of that animal? Learners analyze similar data for more than 50 different animals. They choose a data display and draw conclusions from their graphs.
Curated OER
Graph Related Linear Inequalities
Students explore the concept of linear inequalities. In this linear inequality lesson plan, students graph linear inequalities using Microsoft Excel.
Curated OER
Graphing Solutions To Inequalities On A Number Line
Eighth graders graph solutions to problems on a number line. After discussing algebraic expressions, 8th graders discuss how to solve them using an inequality. They observe examples and then work problems at their desks and on the...
Curated OER
Graphing
Fifth graders practice using math graphs. In this graphing lesson, 5th graders work in groups to develop a topic of their own to represent as a graph. Students collect data and construct a graph for the lesson.
Curated OER
An Introduction To Solving And Graphing Inequalities
Students graph inequalities and solve the equations. In this algebra lesson, students graph their solutions on a number line and create an inequality for a word problem.
Curated OER
Compound Inequalities
In this algebra worksheet, 11th graders solve compound inequalities and graph their solution on a number line. There are 6 questions with an answer key.
Curated OER
Solving Inequalities
In this solving inequalities worksheet, 10th graders solve and complete 9 different problems that include defining various inequalities. First, they define compound inequality and describe the difference between an 'and' and an 'or'...
Virginia Department of Education
Transformationally Speaking
Young mathematicians explore transformations of graphs by graphing sets of functions on the same pair of axes. They use their graphs to determine the effect that the values of a and b in y = ax + b have on the graph of y = x.
5280 Math
More or Less the Same
Tell the story of the math. Given a graph of a linear system, learners write a story that models the graph before crafting the corresponding functions. Graphs intersect at an estimated point, allowing for different variations in the...
Lake Zurich Community Unit
Inequality Word Problems
This inequality word problems activity is ideal to assess your learners' understanding of inequality and linear concepts around solving and writing equations and inequalities. Equations, graphs and real-life scenarios are used to...
Inside Mathematics
Squares and Circles
It's all about lines when going around. Pupils graph the relationship between the length of a side of a square and its perimeter. Class members explain the origin in context of the side length and perimeter. They compare the graph to the...
