Curated OER
How Does Your KinderGarden Grow
Learners find forecast and graph weather by using WeatherBug site, create flower books by using Wiggleworks, and plant radish seeds both on KidPix and in class garden.
Curated OER
Percents: (An Application to Real Life Problems)
Seventh graders explore the concept of calculating percents. In this calculating percents lesson, 7th graders simulate ordering food off of a menu. Students work in groups to calculate the bill, tax, and the tip for the...
EngageNY
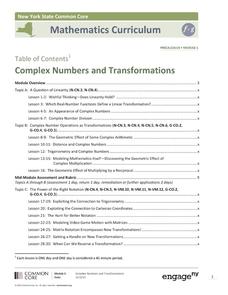
Complex Numbers and Transformations
Your learners combine their knowledge of real and imaginary numbers and matrices in an activity containing thirty lessons, two assessments (mid-module and end module), and their corresponding rubrics. Centered on complex numbers and...
EngageNY
Polynomial, Rational, and Radical Relationships
This assessment pair goes way beyond simple graphing, factoring and solving polynomial equations, really forcing learners to investigate the math ideas behind the calculations. Short and to-the-point questions build on one another,...
101 Questions
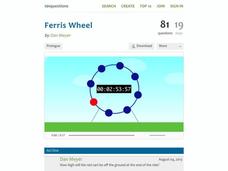
Ferris Wheel
Around and around you'll go! Learners analyze the periodic nature of a Ferris wheel. Using a trigonometric function, they make predictions about the location of a specific car at the end of the ride and its total trips around the circle.
Cloud Front
Direct Variation Worksheet
Direct variation can be applied to many problems and here is a worksheet that has learners practicing them all. The skills include graphing, finding proportional relationships, and solving word problems to show how different factors...
Geophysical Institute
Latitude and Longitude with Google Earth
Travel the world from the comfort of your classroom with a lesson that features Google Earth. High schoolers follow a series of steps to locate places all over the earth with sets of coordinates. Additionally, they measure the distance...
Curated OER
Thinking About Technology: What Is It? How Can It Help Us?
What is technology and how can it help us? Using a worksheet, students read a list and choose practical applications of scientific knowledge, brainstorm examples of home, school and hospital technology, graph answers in a pie chart, and...
Curated OER
Time Management: Piece of Pie
Learners examine their own lives and how well they manage their time outside of school. In this this time management instructional activity, students discover the amount of time they spend on other activities, and create a pie chart with...
Curated OER
How Do Populations Grow?
Students examine how populations grow and how invasive species can affect the balance of ecosystems. They simulate the growth of lily pads, analyze and record the data, and simulate the results of an invasive species on an ecosystem.
Curated OER
How Fast Is Your Car?
Eighth graders discover the relationship between speed, distance, and time. They calculate speed and represent their data graphically. They, in groups, design a ramp for their matchbox car. The goal is to see who's ramp produces the...
Curated OER
THE AREA OF A CIRCLE
Students examine the relationship between circumference and diameter and how to use the formula to find the area of a circle. In this circle lesson students divide into groups and complete an activity.
Curated OER
Taxicab Metric, Circle
Students create a circle using the taxi-cab metric. In this geometry lesson, students identify the properties of circles. They identify the idea of geometric shapes and how they come about.
Curated OER
Spreadsheet Graphs
Students create graphs using information from spreadsheets. They select a topic from the following choices: website use, digital cameras, spreadsheets, calculators or educational software. They tally the class results and create an...
Curated OER
Pet Count Excel Graphing
Students used collected data to distinguish what pets they have or would like to have. They correlate findings with appropriate technology--Excel. At the end of the lesson they tabulate a bar chart and present their findings to the class.
Curated OER
Introduction to Graphical Representation of Data Sets in Connection to Cellular Growth
Students practice graphing relationships between variables by studying topics such as exponential growth and decay. They conduct a series of numerical experiments using a computer model and a variety of physical experiments using mold,...
Curated OER
Birthday Presents: How to Give and Receive
Students discuss giving and receiving presents at a birthday party. In this social skills lesson plan, students practice using manners when giving and receiving gifts. This lesson plan also has other interdisciplinary activities that can...
Curated OER
Graphing Fun
First graders analyze objects and make a graphing picture to analyze the data. In this graphing lesson, 1st graders complete an object graph assessment, a picture graph assessment, and a bar graph assessment to analyze their given objects.
Curated OER
Arc Length and Sectors
Find the length of an arc. High schoolers relate central angles to the area and length of a sector and graph circles on the TI to make predictions.
Curated OER
Is there Treasure in Trash?
More people, more garbage! Young environmentalists graph population growth against the amount of garbage generated per year and find a linear model that best fits the data. This is an older resource that could benefit from more recent...
Curated OER
Trees
Students investigate the parts of a tree, measure its circumference and the length and width of its longest branch. The data is compiled and placed into a bar graph.
Curated OER
Problem-Solving Application: Use a Graph
In this problem solving worksheet, 6th graders use the problem solving steps of understand, plan, solve and look back to answer a graphing question.
Curated OER
My Car Has Potential
Seventh graders investigate how changes in the mass or height of a ramp can affect the change in potential energy. They discuss the concepts of work and energy, then using the four question strategy, they design an experiment that...
Curated OER
Fit With Fiber
Sixth graders investigate the nutritional value of different types of cereal. They take a survey of students that ate breakfast and create a circle graph with the results. Students examine the nutritional information on the sides of the...


