Curated OER
Skittles, Taste the Rainbow
Fifth graders learn and then demonstrate their knowledge of a bar and a circle graph using the classroom data. Students are given a pack of skittles candy. Students create a bar and circle graph indicating the results of the contents of...
Curated OER
Bias in Statistics
Students work to develop surveys and collect data. They display the data using circle graphs, histograms, box and whisker plots, and scatter plots. Students use multimedia tools to develop a visual presentation to display their data.
Curated OER
Using the Landscape Picture Map to Develop Social Studies Skills
Enhance your class' geography skills using this resource. Explore a variety of concepts including production and distribution, and people and the environment. Learners make predictions and identify locations on maps. This is a creative...
Curated OER
"Graph It"
Young scholars work in teams to conduct short surveys of their classmates. They show their results using at least two different types of graphs.
Students separate into teams and are asked that each team to choose something that they are...
Curated OER
Usage and Interpretation of Graphs
Students review graphing and use processing skills to solve problems.
Curated OER
Solving Inequalities and Graphing
Students solve and graph inequalities on a number line. In this algebra lesson, students solve using addition, subtraction, multiplication and division and graph their solutions using open or closed circles. They graph with 80%-90%...
Curated OER
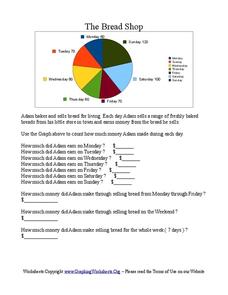
The Bread Shop
In this pie chart worksheet, students use the pie chart graph to count the money Adam made in the Bread Shop. Students complete 10 questions.
Curated OER
Moving Out
Young scholars determine their cost of living. For this determining their cost of living lesson, students think of ten necessary things they would need if they moved out of their parents house. Young scholars research the...
Curated OER
Which Amusement Park Would You Choose?
Students analyze data related to amusement parks and create a spreadsheet to display the data. They read the data and predict which amusement park they think is safer, create a spreadsheet and graph, and write a proposal based on their...
Curated OER
Statistics Problems
In this statistics instructional activity, 3rd graders answer questions about different graphs including bar graphs, picture graphs, line graphs, and more. Students complete 20 multiple choice questions.
Curated OER
Graphing Parabolas and Circles
Students graph parabolas and circles. In this algebra lesson, students create a table of values and graph the coordinate pairs to create a graph. They graph a circle using the radius and center.
Bowland
Fruit Pies
Scholars use formulas for the area of a circle and the area of a rectangle to determine the number of pies a baker can make from a particular area of dough. They must also take into account rolling the remaining dough into a new sheet.
Curated OER
Matrix Madness!!
Perform operations to add, subtract, multiply and divide matrices. Then solve problems with vectors using matrices. A three day lesson: Matrix Madness, Mystical Matrices, and Decode the Encode. The last lesson has prizes that the class...
Kelly's Kindergarten
June Daily Activities
This is an absolute must-have resource for early elementary teachers! Here you'll find a collection of activities and worksheets for each day of the month of June, with topics ranging from ordering numbers on a calendar or identifying...
Virginia Department of Education
Prokaryotes
Lead your biology class on a cell-sized adventure! Emerging scientists construct models of prokaryotes, then design an experiment to properly grow a bacterial culture. They conclude the activity by viewing the culture under a microscope....
Curated OER
The Unit Circle
Students solve problems using the unit circle. For this precalculus lesson, students identify angles using the properties of the unit circle. They observe the trigonometric graphs and sine, cosine and tangent.
Curated OER
Circle Relationships
Students explore circles. In this geometry lesson, students explore the relationship between the circumference of a circle, the distance a ball travels, and the number of rotations the ball must make in order to travel a certain...
Curated OER
Tangents to a Circle
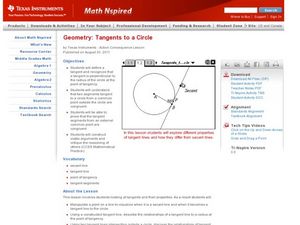
Young scholars construct tangent lines. In this geometry instructional activity, students identify the point of tangency, secant and tangent lines. They graph the lines on the Ti and make observations.
Curated OER
Evaluating the Products of Chords of a Circle
Pupils investigate chords and make predictions. In this geometry lesson, students graph circles and calculate the measurement of each chord. They perform the calculations and make conjectures.
Curated OER
Pies and Percentages--Learning About Pie Graphs
In this pie graph activity, students draw a pie graph for the zookeeper with the data he collected, choose a different color for each animal species and make a key to the graph.
Curated OER
The Solar System
Students construct a sketch of the planets in our solar system using concentric circles and angles. In this solar system lesson plan, students plot the position of each planet on concentric circles using graph paper. The sun is included...
Texas Instruments
Exploring Tangents
Explore the concept of tangent lines. In this tangent line lesson plan, learners graph a circle and two lines on their graphing calculator using Cabri Jr. Students construct the lines so that they both intersect at a given point and are...
Curated OER
ELECTRICITY 1
Fifth graders examine the importance of electricity to their everyday lives, practice plotting and interpreting data on a bar graph, and reflect in their journals about how their lives would change without electricity.
Curated OER
Cabri Jr. Inscribed Angles
Young scholars construct inscribed angles using Cabri Jr. They draw a circle on their graphing calculator, then construct an inscribed angle and measure its angle measures. Learners drag the inscribed angle around the circle. They make...


