Curated OER
Instantaneous Rate of Change of a Function
Pupils draw the graph of a door opening and closing over time. They graph a given function on their calculators, create a table of values and interpret the results by telling if the door is opening or closing and evaluate the average...
Inside Mathematics
Sorting Functions
Graph A goes with equation C, but table B. The short assessment task requires class members to match graphs with their corresponding tables, equations, and verbalized rules. Pupils then provide explanations on the process they used to...
EngageNY
Structure in Graphs of Polynomial Functions
Don't allow those polynomial functions to misbehave! Understand the end behavior of a polynomial function based on the degree and leading coefficient. Learners examine the patterns of even and odd degree polynomials and apply them to...
Illustrative Mathematics
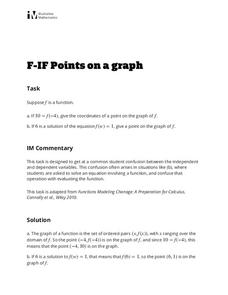
Points on a Graph
Learners practice using their knowledge of how to interpret a function and use function notation. The activity includes two questions. Given an input of a function and its output, the first question asks learners to write the ordered...
Mathematics Assessment Project
Representing Quadratic Functions Graphically
Sometimes being different is an advantage. An engaging activity has scholars match cards with quadratic functions in various forms. Along the way, they learn about how each form highlights key features of quadratic functions.
University of North Texas
Library of Functions
Join the family picnic and see how all the functions come together in a PowerPoint that highlights their main features. As it includes topics such as domain, range, and intercepts, the slides are a great guide to promote class discussions.
University of Northern Texas
Continuity
Continue a study of calculus by using a slideshow to introduce the concept of continuity. After defining the term, the presentation provides examples of functions that are discontinuous and introduces different types of...
CK-12 Foundation
Graphs of Absolute Value Equations: Absolute Value Distance
The sole purpose of this interactive is to graph a function representing the distance of a car from a shoe store. Scholars use an interactive to graph such an absolute value function. They then answer a set of challenge questions...
Flipped Math
Unit 7 Review: Exponential Functions
Take a break from learning new information and take time to review. Scholars review the unit by completing some practice problems. They rewrite expressions using exponents, solve exponential equations, graph exponential functions,...
CK-12 Foundation
Function Rules based on Graphs: Making Money in the Hat Business
Hats off to those learning about the graphs of functions. Individuals use an interactive to plot points representing profits for a hat business. They identify a quadratic equation to represent this function and answer challenge questions...
K20 LEARN
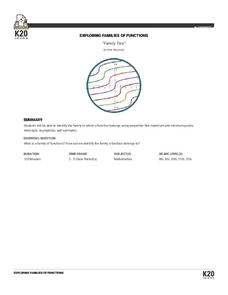
Family Ties: Exploring Families OF Functions
They say it runs in the family. Small groups use a card sorting activity to group graphs of functions into families. After grouping by families, the class develops conclusions for parent functions and create a graphic organizer.
Radford University
Transformational Graphing in the Real World: Bacteria – Growth or Decay?
Grow—not decay—your knowledge of exponential functions. Young mathematicians graph exponential functions and explore how transformations affect the graphs. They decide whether the functions represent growth or decay in the context of...
Illustrative Mathematics
Function Rules
Function machines are a great way to introduce the topic of functions to your class. Here, you will explore the input and output to functions both using numerical and non-numerical data. Learners are encouraged to play with different...
Curated OER
Graphing Rational Functions
In this Algebra II worksheet, 11th graders graph rational functions and use the graph to solve real-life problems. The four page worksheet contains forty-one problems. Answers are not provided.
Curated OER
A Sum of Functions
Collaborative learners will see the geometric addition of functions by graphing the sum of two graphed curves on the same coordinate plane. This task then naturally flows into giving learners the algebraic representation of the curves...
Ontrack Media
Chart of Parent Functions
The characteristics of parent function vary from graph to graph. Let learners decipher the graph, table of values, equations, and any characteristics of those function families to use as a guide. The nicely organized page displays the...
EngageNY
Transformations of the Graphs of Logarithmic and Exponential Functions
Transform your lesson on transformations. Scholars investigate transformations, with particular emphasis on translations and dilations of the graphs of logarithmic and exponential functions. As part of this investigation, they examine...
EngageNY
Graphing the Sine and Cosine Functions
Doing is more effective than watching. Learners use spaghetti to discover the relationship between the unit circle and the graph of the sine and cosine functions. As they measure lengths on the unit circle and transfer them to a...
EngageNY
Transforming the Graph of the Sine Function
Build a solid understanding of trigonometric transformations through exploration. Learners work in teams to analyze the effects of different algebraic components on the graph of a sine function.
Mathematics Assessment Project
Sorting Functions
There's no sorting hat here. A high school assessment task prompts learners to analyze different types of functions. They investigate graphs, equations, tables, and verbal rules for four different functions.
EngageNY
Graphing Factored Polynomials
Young mathematicians graph polynomials using the factored form. As they apply all positive leading coefficients, pupils demonstrate the relationship between the factors and the zeros of the graph.
Alabama Learning Exchange
Building Functions: Inverse Functions from Tables and Graphs
Is the inverse a function? Scholars learn how to examine a function to answer this question. Using an online interactive, they examine the properties of inverse functions to compare to the original function.
Illustrative Mathematics
Telling a Story With Graphs
Turn your algebra learners into meteorologists. High schoolers are given three graphs that contain information about the weather in Santa Rosa, California during the month of February, 2012. Graph one shows temperatures, graph two...
EngageNY
Graphs Can Solve Equations Too
There are many equations Algebra I learners are not ready to solve. Graphing to solve gives them a strategy to use when they are unsure of an algebraic approach to solve the problem. The lesson exposes learners to a wide variety of types...
Other popular searches
- Linear Functions and Graphs
- Parent Functions and Graphs
- Functions and Graphs
- Graphs of Functions Calculus
- Linear and Nonlinear Graphs
- Algebra Functions Graphs
- Graphs of Functions Circles
- Represent Functions as Graphs
- Functions Graphs


