Balanced Assessment
Vacation in Bramilia
This performance task gives the population model of different types of flies and asks scholars to analyze the two populations. After interpreting the functions individually, participants compare the two populations and find the time...
US Department of Commerce
Changes in My State
So much can change in seven years. Young statisticians choose three types of businesses, such as toy stores and amusement parks, and use census data to determine how the number of those businesses in their state changed between 2010 to...
Radford University
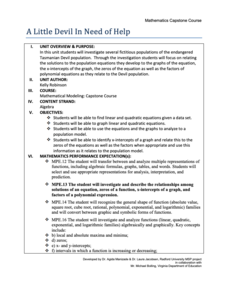
A Little Devil In Need of Help
Math modeling to help endangered species? Scholars first investigate linear and exponential equations and graphs that model fictitious animal populations. They consider how key features of the graphs relate to the situation. As a final...
PBS
The Lowdown — What You Need to Know about Immigration Reform
We're all from somewhere. An informative interactive provides information on immigration, foreign-born residents, and deportations. Pupils interpret the graphics to analyze how these quantities have changed over time. The resource is...
Radford University
Plumbing Task
Make sure it flows smoothly. Pairs research plumbing codes to find the required slope for a sewer line. Using the information, groups answer several questions involving interpreting the slope. Pupils determine the cost of pipe to run a...
Flipped Math
Calculus AB/BC - Defining Limits and Using Limit Notation
There's no limit to what one can learn about limits. The second of 18 videos in Unit 1 - Limits and Continuity focuses on understanding the basic concept of a limit. Pupils learn the definition of limits and see how to determine a limit...
Polar Trec
Global Snow Cover Changes
Snow is actually translucent, reflecting light off its surface which creates its white appearance. Pairs or individuals access the given website and answer questions about snow cover. They analyze graphs and charts, examine data, and...
Flipped Math
Calculus AB/BC Mid-Unit 1 Review: Limits
Limit the amount one forgets about limits. A mid-unit review lesson has individuals complete a instructional activity of problems on limits. They go over the meaning of limits, evaluate limits algebraically, use graphs and tables to find...
NASA
Cloudy vs. Clear - Graphs
Explore the link between solar energy and cloud cover using real data from NASA from China! Future climatologists analyze and interpret graphs of solar energy on clear and cloudy days using a literacy cube. Investigators draw conclusions...
Anti-Defamation League
Sixty Years Later
Has any progress been made in desegregating schools since 1954's Supreme Court case Brown v. Board of Education? To find out, class members examine charts and graphs representing U.S. schools' racial, ethnic, and socioeconomic...
Anti-Defamation League
Women’s Inequity in Pay: Could It Be Sexism, Implicit Bias or Both?
Equal pay for equal work? High schoolers research the reasons for the inequity in women's pay. They read articles, examine graphs, engage in discussion, and then craft an essay in which they suggest a way to address the gender wage gap.
Curated OER
Creating Graphs from Tables
Students interpret data from tables and then create a graph to show the same data in a different organization.
Curated OER
Interpreting a Bar Chart
In this interpreting bar charts worksheet, students examine a bar chart that shows how many people traveled on boats that took them out dolphin watching. They answer 8 questions about the times and number of people on the boats.
Curated OER
Bar Graph Lesson
Students make a bar graph. In this graphing lesson, students discuss why bar graphs are used and are shown bar graph examples. Students create their own bar graph to compare the heights of different things around the world. Students...
Curated OER
Graphs
Eighth graders analyze graphs on a worksheet and in newspapers and magazines. In this graphs lesson plan, 8th graders also record their thoughts in a journal.
Curated OER
Circle Graphs
Sixth graders interpret, create, and display data in a circle graph. In this circle graph lesson plan, 6th graders use a compass, protractors, pizza boxes, and more to create a circle graph and analyze the data they put into it.
Curated OER
Using Computers to Produce Spreadsheets and Bar Graphs
Students review graphing terminology and how to plot data points, how to input data into a spreadsheet, and how to make a chart using a computer.
Curated OER
Graph Your Motion
Students graph their linear equations. In this algebra lesson, students examine their lines and relate it to the slope or rate of change. They relate the steepness of the line to the slope being positive, negative or zero.
Curated OER
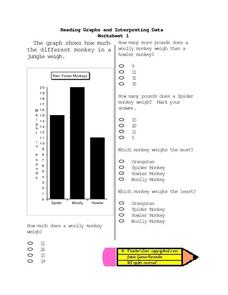
Reading Graphs and Interpreting Data
In this math worksheet, 4th graders interpret a graph and answer five questions to determine the weights of three different types of rain forest monkeys.
Curated OER
English Lesson for Grade 11
Eleventh graders role play a scenario where they have to make a decision. In this english lesson, 11th graders interpret graphs. They research about the life of different historical figures.
Curated OER
My Test Book: Stem and Leaf Plots
In this math skills learning exercise, students solve 10 multiple choice math problems which require they interpret a stem and leaf plot. Students may view the correct answers.
Curated OER
Graphing in the Information Age
Middle schoolers create a variety of graphs based on population data. In this statistics lesson, students use data that can be gathered on-line to make a bar chart, line graph, and circle graph.
Curated OER
Graphs
Students investigate circle and bar graphs. In this middle school mathematics lesson, students determine which kind of graph is suitable for a given situation and create circle and bar graphs.
Other popular searches
- Interpret Charts and Graphs
- Interpreting Bar Graphs
- Interpreting Line Graphs
- Interpreting Circle Graphs
- Interpret Graphs
- Reading Graphs and Charts
- Graphs Interpreting Data
- Bar Graph Interpretation
- Reading Graphs in Science
- Timed Reading Graphs
- Interpreting Graphs Algebra
- Math Interpreting Bar Graphs


