PBL Pathways
College Costs
Predict the year that college costs will double in your state using linear modeling. The first part of this two-part project based learning activity asks young mathematicians to use data from the College Board. They graph the data,...
Curated OER
Analyzing Tree Rings to Determine Climate Change
Middle schoolers examine how to locate and access data sets. For this climate change lesson students import data into Excel and graph it.
Curated OER
Creating Climographs
Students use satellite data to compare precipitation and surface temperatures on different islands. In this satellite lesson students create graphs and explain the differences between weather and climate.
Curated OER
Labeling the World
Sixth graders conduct research on the countries found on the labels on their clothing. They locate the countries on a map, research the labor practices on countries that export clothing to the U.S., and create a graph using the information.
Curated OER
Weather instruments
Learners explore weather instruments. In this weather lesson, students make rain gauges, anemometers, and barometers following the instructions given in the lesson. Learners set up a weather station using their instruments and record and...
Curated OER
Sea Floor Spreading I
Students use Excel to explore the geodynamics Model equation for ocean depth around a sea-floor spreading center. They complete an introductory tutorial on Excel for students with no prior Excel experience.
Curated OER
The Survey Says
Learners experience the development of statistical data. In groups, they construct a survey questionnaire for a target audience. Students produce the questionnaire, distribute it, collect it, and tabulate the data. Using EXCEL, the...
Polar Trec
Temperature Profile above the South Pole
Collecting and understanding data is a big part of understanding the world and how it changes. To better grasp what temperatures are changing and how they affect global populations, learners create a graph based on the date provided....
Curated OER
Circuits
Students draw a schematic diagram of parts needed to build an op-amp. For this physics lesson, students test the operation of their machine. They graph and analyze data using excel.
Curated OER
Running On Empty
Students research causes of rising gasoline prices. They collect data on fluctuating gasoline prices and analyze the data using Excel. They write comparative essays supporting their results and create PowerPoint presentations to present...
Curated OER
May The Force Be With You
Eighth graders investigate Newton's Laws of Motion. They use the example of a roller coaster for illustration purposes. A force associated with a roller coaster is tested, data graphed, and a conclusion is drawn. They use excel in order...
Curated OER
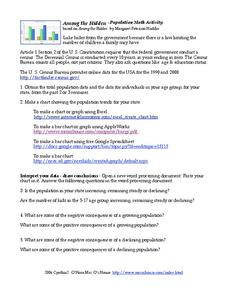
Among the Hidden - Population Math Activity
In this population worksheet, students collect data on population by researching the Census Bureau and then make online graphs and answer short answer questions about the data. Students complete 5 problems total.
101 Questions
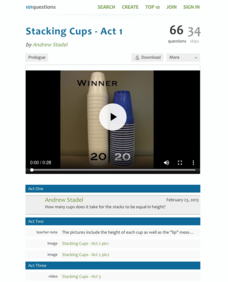
Stacking Cups
Facilitate an understanding of equality using a modeling task. After watching different-sized cups being stacked, learners use their math skills to determine when the height of each cup tower will be the same. Meant as an introduction to...
Reardon Problem Solving Gifts
Teaching Problem Solving Strategies in the 5-12 Curriculum
Address any kind of math concept or problem with a series of problem-solving strategies. Over 12 days of different activities and increasing skills, learners practice different ways to solve problems, check their answers, and reflect...
Spectrum
Grade 5 Standardized Test Prep
Here you'll find a great sampling of practice standardized test questions organized into four sections: ELA, mathematics, social studies, and science. Help your learners become familiar with the types of multiple-choice questions...
Towson University
It's a Gassy World!
How much does your class know about the relationship between climate change and carbon dioxide? Science scholars explore the nature of greenhouse gases and rising ocean temperature through demonstrations, research, and experiments. The...
Chicago Botanic Garden
Are Global CO2 Levels Changing?
According to the Mauna Loa observatory, carbon dioxide levels increased by 3 ppm in our atmosphere between 2015–2016. Individuals analyze carbon dioxide data from around the world and then share this with a home group in lesson...
Curated OER
Tracking Data Using Quickoffice on a Palm Handheld
Sixth graders keep track of the amount of garbage they threw away over 3 days time. They graph and analyze data and participate in discussions. They draw conclusions based on their data.
Curated OER
Food for Thought
Third graders conduct a survey of their class' favorite foods voting on 3-4 favorites overall. They then go to the computer lab and examine how to produce a horizontal bar graph by graphing the favorite foods of the class.
Curated OER
How Do Plants Grow?
Students investigate plant growth. In this plant growth lesson, students investigate what would happen to plants if they did not have water and sunlight. Students conduct experiments to determine what plants need. Students create a...
Curated OER
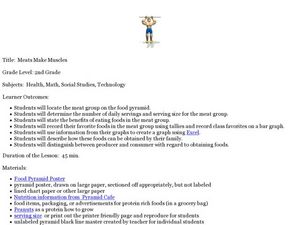
Meats Make Muscles
Second graders explore the meat group of the food pyramid. In this nutrition and diet lesson, 2nd graders study the benefits of eating foods in the meat group, collect data regarding their classmates' favorite foods, and create a graph...
Curated OER
Valentine Heart Candy
Each student gets a box of candy Valentine hearts. The students open the box and count how many of each colored heart they have in their box. The students use this information to make a bar graph and answer follow-up questions.
Curated OER
Do You Measure Up?
Students measure their height and then they will input the information into a spreadsheet. After the data is entered, students will use the material gathered to create a bar graph showing the heights of people in their class.
Curated OER
How Do You Get to School?
Third graders talk about all the various ways they get to school. They make a list of all the bus numbers that the students use. They also list all the other methods of transportation used and solidify a hypothesis.


