Curated OER
Data and Probability: What is the Best Snack?
In this math/nutrition lesson, the nutritional value of 3 snack foods is recorded on a data chart and represented on a bar graph. Students analyze and compare information, construct data charts and related bar graphs, and draw...
Curated OER
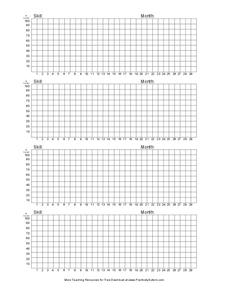
Skills Graph: Template
It doesn't matter what disability your pupil has, if he has an IEP, you'll have to show he has met his goals. Included here is a series of 4 graphs which allow you to chart the skill, month, and percentage correct. I have used of this...
Curated OER
Nutrition and Food Security
Examine the three basic nutrients and their effects on the body. Fifth graders will research data to construct a bar graph and then demonstrate the relationship between malnutrition and food security. This is a very comprehensive...
Curated OER
Digestion & Nutrition: a Case Study
Students explore digestion/nutrition and utilize scientific investigation skills. They complete meal logs for several days and graph their results. After analyzing their data, they write formal lab reports.
Curated OER
Data Collection Graph
To be used however fits your needs most, this data collection graph includes spaces to chart a years worth of data. Print, keep handy, and fill out as the target skill is performed.
Curated OER
Hygiene Potato Graphs
Fifth graders discuss the importance of proper hygiene. After watching their teacher peel potatoes, they discuss why she was wearing rubber gloves. They demonstrate how to wash their hands properly and why one should never touch...
Curated OER
Making Logic Out of Madness
Tenth graders organize and interpret data from a student health program. In this physical education lesson, 10th graders use a body composition analyzer over 8 weeks to determine the validity of a student health program. Data obtained...
Curated OER
Apple Adjectives
Study different apple varieties and use appropriate adjectives to describe them. Learners alphabetize both the apple names and the adjectives before creating spreadsheet, bar, and pie graphs. A mix of language arts, technology, and math!
Curated OER
All Choked Up By Smoking Statistics
Scholars use the article "More College Students Are Smoking, Study Says" as a springboard for discussion on the reasons why people smoke cigarettes. They investigate different methods of graphing statistics by using the data provided in...
Curated OER
Surviving AIDS
Enhance your middle and high schoolers' research skills with this lesson. After viewing a video clip about HIV and AIDS, high schoolers identify the facts and issues surrounding the disease. They work together to create a newspaper...
Curated OER
Counting Votes
Here's a great way to combine a good class discussion on nutrition with math. A class discussion on what can be made from vegetables is held, then learners all vote for their favorite vegetable. A graph is produced that shows the...
Curated OER
Youth Obesity: Schools Fight Back
Explore nutrition and healthy eating habits with a study on youth obesity. Learners watch a PBS documentary on the obesity epidemic which discusses government programs aimed at healthier choices, as well as more localized efforts. Kids...
Curated OER
Let's Learn About Firefighters!
Students explore, analyze and study about fire fighters and fire safety. They listen to a book, list what they already know about firefighters and fire safety rules and compare/contrast types of firefighters. Each student then writes a...
Baylor College
Body Strength
Your young learners will discover how muscular strength and endurance can increase with this truly hands-on activity! Beginning by writing an acrostic for the word strength, class members then engage in tracking their ability to squeeze...
Missouri Department of Elementary
STAR Deputies
Scholars become STAR deputies in a lesson that encourages them to be problem-solvers. Small groups gather to complete a worksheet by answering questions. A discussion presents a scenario in which a problem occurs on the playground. Small...
Baylor College
Body Mass Index (BMI)
How do you calculate your Body Mass Index, and why is this information a valuable indicator of health? Class members discover not only what BMI is and practice calculating it using the height and weight of six fictitious individuals, but...
Curated OER
Death by Particles
Emerging epidemiologists define relative risk and read an article about the effect of particulate pollution on the cardiovascular health of women. They record the relative risk values, graph them, and answer analysis questions. This is a...
Curated OER
Finding Your Pulse Rate
Fifth graders demonstrate how to find their pulse and count the beats after a certain amount of time. In cooperative pairs, 5th graders use a stopwatch to keep track of their partner's heart rate in seconds. Pairs make a graph from their...
Curated OER
Be a Good Friend
Students discover characteristics of a good friend. For this social skills lesson, students read Clifford's Manners and discuss ways Clifford used his manners in the story. An activity that rewards students for modeling being courteous...
Curated OER
Epidemiology: Graphing and Analyzing Health Data
Young scholars graph data on fetal and infant mortality rates collected by the Centers for Disease Control and Prevention. They identify trends in the data and propose potential causes for the trends.
Missouri Department of Elementary
What Are Bullying and Harassment? Part 2
After reviewing notes from the previous lessons, small groups obtain a scenario card that describes a situation in which bullying is happening. Peers discuss the event and brainstorm two solutions using the STAR method then present their...
Missouri Department of Elementary
Dealing with Peer Influence: What Are Bullying and Harassment?
Scholars examine examples of peer pressure and discuss how specific actions negatively affect one's well-being. Learners gather in small groups to write two scenarios in which peer pressure is used. They reference the STAR method in how...
Curated OER
Nicotine addiction and youths
Students read CNNfyi article: "Nicotine addiction can begin in days, study says," and have class discussion about the effects of nicotine on the human body.
Other popular searches
- Graphing Skills Lesson Plans
- Basic Graphing Skills
- Organizing and Graphing Data
- Introducing Graphing Skills
- Graphing Skills Using M&ms
- Graphing Skills in Science
- Graphing Skills for Prek
- Graphing Skills With Fruits
- Graphing Skills in Chemistry
- Graphing Skills for Perk
- Graphing Skills Worksheet
- Reading Graphing Skills


