Hi, what do you want to do?
Curated OER
View Tubes
Eighth graders decide if the length of a viewing tube, its diameter, or the distance from an object affects the type of data collected and the resulting graph through a series of experiments.
Curated OER
Confusing Colors!
Fourth graders collect data, graph their data, and then make predictions based upon their findings. They's interest is maintained by the interesting way the data is collected. The data collection experiment is from the psychology work of...
Explore Learning
Quadratics: Polynomial Form
Throught this subscription-based sight, learners explore different aspects of the parabola by changing equations from standard to vertex form. Next, find the general form of the vextex based on the values of a, b, and c, and investigate...
National Security Agency
Multiple Representations of Limits
After an introductory activity to demonstrate the theory of a limit, additional activities approach a limit from graphical, numerical, and algebraic methods. The activity looks at the multiple ways of understanding and evaluating a...
American Statistical Association
Scatter It! (Using Census Results to Help Predict Melissa’s Height)
Pupils use the provided census data to guess the future height of a child. They organize and plot the data, solve for the line of best fit, and determine the likely height and range for a specific age.
American Statistical Association
How Tall and How Many?
Is there a relationship between height and the number of siblings? Classmates collect data on their heights and numbers of brothers and sisters. They apply statistical methods to determine if such a relationship exists.
Curated OER
Rewriting Equations &Formulas
Practice with literal equations. Solve for one variable in terms of another. Find the value of y given specific values of x. This short worksheet would make a good warm-up activity at the beginning of class or a quick assessment at...
Inside Mathematics
Scatter Diagram
It is positive that how one performs on the first test relates to their performance on the second test. The three-question assessment has class members read and analyze a scatter plot of test scores. They must determine whether...
Curated OER
Introduction to Arithmetic and Geometric Sequences
Students examine the concept of sequences. Students create a sequence using varied starting numbers, multipliers, and add on values. Students practice determining the starting values to use in order to produce a desired sequence.
Curated OER
Circle Relationships
Students explore circles. In this geometry lesson, students explore the relationship between the circumference of a circle, the distance a ball travels, and the number of rotations the ball must make in order to travel a certain...
Kenan Fellows
Math Made Simple as 1-2-3: Simplified Educational Approach to Algebra
Writing an equation of a line is as easy as m and b. A lesson presentation gives individuals different strategies for writing equations of lines. Some items provide a slope and a point while others provide two points. Whatever the given,...
Curated OER
What Are The Chances
Students calculate the probability of an event occurring. In this probability lesson, students differentiate between independent, dependent or compound events. They find the range of the data.
Pennsylvania Department of Education
Alike and Different
Students compare and contrast objects and are introduced to a Venn Diagram. In this alike and different lesson, students make observations regarding properties of objects. Students classify object and build ideas about variables....
Curated OER
Topic 6: Evaluating and Presenting Results
Students construct spreadsheets from raw data. In this spreadsheet construction lesson, students compile data into Microsoft Excel. Students familiarize themselves with entering and presenting data in a spreadsheet.
Texas Instruments
Texas Instruments: Mc Dougal Littell Mid. School Math: Graph Non Linear Functions
Students will compare functions by graphing the functions and describing the patterns in the graphs.
Shodor Education Foundation
Shodor Interactivate: Lesson: Graphs and Functions
This lesson plan is directed at introducing students to how to graph functions on the Cartesian coordinate plane. They will experience several categories of functions including lines and parabolas. Resources and interactive tools are...
Purple Math
Purplemath: Graphing General Polynomials, Radicals, Rationals, and Piecewise Fun
This resource provides an overview of graphing, giving examples of general polynomial, radical, rational, and piecewise functions. Also includes advice on common mistakes made by students.
Math Planet
Math Planet: The Graph of Y = Ax^2 + Bx + C
A nonlinear function that can be written on the standard form ax^2 + bx + c,where a is not = 0, is called a quadratic function. All quadratic functions hava a U-shaped graph called a parabola.
Other
Graph pad.com: Comparing Linear Regression to Nonlinear Regression
This resource presents a complete and detailed look at linear regression. This guide provides lots of details and graphs to explain each concept.
Math Planet
Math Planet: Algebra 1: Exponential Growth Functions
An exponential function is a nonlinear function that has the form of y=a*b^x, where a != 0, b > 0. An exponential function with a > 0 and b > 1, like the one above, represents an exponential growth and the graph of an...
Khan Academy
Khan Academy: Graphs of Nonlinear Piecewise Functions
Given the graph of a nonlinear piecewise function, find its formula.
Other
Graph Pad: Data Analysis Resource Center
The GraphPad Statistics Guide is both a guide to doing statistical analyses with GraphPad Prism 7, and a concise review of statistical principles, emphasizing clear explanations with very little math. The GraphPad Curve Fitting Guide is...
William Mueller
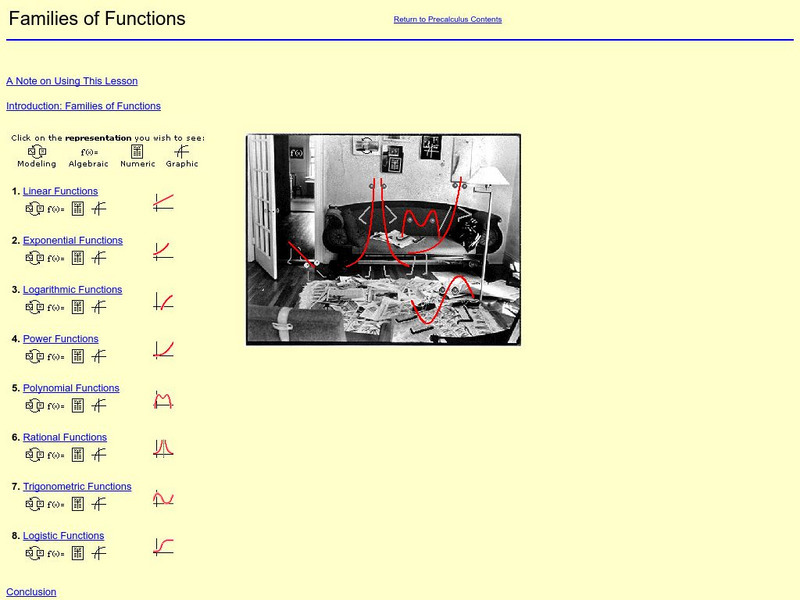
William Mueller: Families of Functions
Meet the Function Family! Each member of the family has examples of their graphs and descriptions of the types of real-world situation that produce those graphs.
Math Notes and Math Tests
Pre Calculus Notes: Nonlinear Inequalities [Pdf]
Students explore nonlinear inequalities. Graphs and detailed examples are included.


![Pre Calculus Notes: Nonlinear Inequalities [Pdf] Activity Pre Calculus Notes: Nonlinear Inequalities [Pdf] Activity](https://static.lp.lexp.cloud/images/attachment_defaults/resource/large/FPO-knovation.png)