CK-12 Foundation
Understand and Create Histograms: Car Sales
Create a history of car sales. Pupils create a histogram/bar graph to show the number of car sales made during the week. Using the data display, learners calculate numerical summaries of the data and find the percent of cars sold during...
CK-12 Foundation
Frequency Polygons: Constructing a Frequency Polygon
Connect the dots on frequency. Given a distribution table of scores on an assessment, learners create a frequency polygon by moving points on a graph to the correct frequency. The pupils use the display to answer questions about the...
CK-12 Foundation
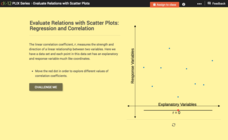
Evaluate Relations with Scatter Plots: Regression and Correlation
Introduce the concept of a correlation coefficient using an interactive lesson. Learners begin by manipulating a correlation coefficient and watching a graph change to represent the new value. Questions help strengthen their...
CK-12 Foundation
Stem-and-Leaf Plots and Histograms: Digital Photography
Cameras use histograms to communicate the exposure of a photograph. An interesting lesson uses this idea to help learners deepen their understanding of histograms. It highlights the skew of the graphs by showing under- and overexposed...
CK-12 Foundation
And and Or Statements: Number Lines
Compound statements are actually quite simple. A virtual interactive provides a means to graph solution sets to compound statements involving and and or. Users then answer a few challenge questions on these solution sets.
CK-12 Foundation
Properties of a Normal Distribution: Uniform Distributions
There's nothing normal about an extraordinary resource. Scholars change the dimensions of a normal distribution using a slider interactive. Determining the area under the graph gives probabilities for different situations.
CK-12 Foundation
Infinite Limit Type: Evaluating Limits of Rational Functions
Rational functions become less mysterious when you know about limits. Individuals use an interactive to move a rational function on a coordinate plane and to investigate function values for certain x-values. They see how the limit...
CK-12 Foundation
Infinite Limit Type: Asymptotes and End Behavior Question
There are an infinite number of reasons to use the resource. Scholars drag vertical and horizontal lines to the graph of a rational function to identify all asymptotes. They investigate the connection between asymptotes and limits to...
CK-12 Foundation
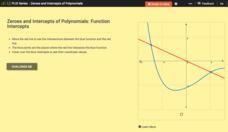
Zeroes and Intercepts of Polynomials: Function Intercepts
There is zero reason not to use the resource. Given a graph with a polynomial function and a linear function, scholars move the line in an interactive. To wrap up the lesson, they note how zeros and intersection points change.
CK-12 Foundation
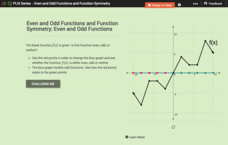
Even and Odd Functions and Function Symmetry: Even and Odd Functions
Even, odd, or neither? Pupils study even and odd functions using a well-balanced interactive. They determine whether a given function is even or odd from its graph.
CK-12 Foundation
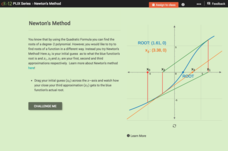
Newton's Method
Does the accuracy of the first guess make a difference down the line? Learners investigate the effects of the iterative process of finding roots, using Newton's Method. By moving the initial guess of a root on a graph, pupils observe the...
CK-12 Foundation
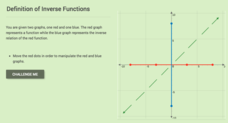
Definition of Inverse Functions
Investigate the definition of inverse functions graphically. Using the interactive, scholars create a graph of a function and view its resulting inverse. They then determine whether a group of functions have inverses that are also...
CK-12 Foundation
Limit of a Sequence: Finding the Limit of a Sequence (Part 1)
Put a squeeze on a sequence. An interactive provides a graphical display of a sequence. Using the graph, learners determine the algebraic expression for the sequence. Pupils use the general definition of a limit of a sequence to find the...
Federal Reserve Bank
The Story of the Federal Reserve: High School Lesson Plan
Is there a bank for the banks? Pupils analyze the complexities of the Federal Reserve system by breaking it down into easy-to-understand sections. Step-by-step investigation using flow charts and graphs of how the monetary system works...
Curated OER
Integration: Geometry, Parallel and Perpendicular Lines
In this math worksheet, students write linear equations in slope-intercept form that passes through the given point. On the last 8 equations, students write the equation of the perpendicular line.
Curated OER
Parabola (Lab Version)
Students develop definition for parabola, explain relationship between properties of the graph of a parabola and its equation, explain how the equation of a parabola can be written in different forms, and solve problems that relate the...
Curated OER
Standard Conic Section
In this precalculus activity, students put the equations in standard form and solve the problems focusing upon finding the conic sections for the two questions.
Curated OER
Raising the Bar While Hogging the Ham (Radio That Is)
Pupils create a bar graph that communicates an amount without the need to know the exact data, determine what scale to use to best represent the data and use their bar graph to persuade others.
Curated OER
McCadam's Quarterly Report
Fourth graders problem solve a problem from a local business using data, generating graphs, and draw conclusions. They submit their findings in a business letter format with feed back from a company's plant manager.
Curated OER
Other kinds of groups- part 4 of 5
Students compare and contrast characteristics of groups. Students create graphs using various symbols of different groups. Students make maps of their neighborhood 'groups'.
Curated OER
Survey Says
Middle schoolers complete a survey questionaire and total the responses. They create a game like Family Feud with the top answers. They create a bar graph of one of the questions after the game is finished.
Curated OER
Which is Your Favorite Dr. Seuss Book?
In this student survey worksheet, students gather information on classmates' favorite Dr. Seuss books. Students use a second worksheet to graph the results of their surveys.
Curated OER
Properties of a Parabola
In this algebra worksheet, students identify the properties of a parabola. They factor and graph quadratic equations. There are 18 questions.
Curated OER
Mobile vs. Money
Learners research the internet and use the information they find to plot straight line graphs. They use graphs to make comparisons of the various packages offered. Students interpret graphs and solve problems based on varying parameters.


