Virginia Department of Education
Curve of Best Fit
Which function models the data best? Pupils work through several activities to model data with a variety of functions. Individuals begin by reviewing the shapes of the functions and finding functions that will fit plotted data points. By...
Mathematics Assessment Project
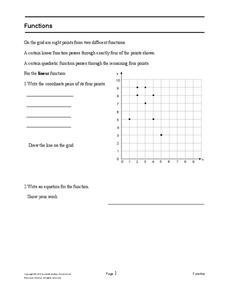
Functions
After identifying which of the given coordinate points fall on the graph of a line and which fall on the graph of a parabola, pupils write equations for each function.
Curated OER
Solving Quadratic Systems
In this solving quadratic systems worksheet, 11th graders solve 8 different problems. First, they solve each system of equations algebraically. Then, students solve each system of inequalities by graphing on the grids provided for each...
Curated OER
Mathematics Within: Algebraic Patterns
Students discover patterns in linear equations by playing a dice game to collect data. They graph the data and analyze the patterns of the lines created by the data. The class then compares the individual graphs to evaluate the position...
Achieve
Stairway
It's the stairway to learning! Scholars research all aspects of building a staircase. Using information from building codes, they write and graph a system of inequalities to analyze the constraints. The completed project is a scale model...
Bytes Arithmetic
Geometry Pad+
Graphing paper, pencil, ruler, protractor, and compass, all get replaced or supplemented with this dynamic geometry application. Here, you can create, move, and scale many different shapes, as well as, explore and change their properties...
Curated OER
Solutions, Solutions, Could it Be?
Students graph and solve linear system of equations. In this algebra activity, students use algebraic and graphing methods to solve their systems. They find the point of intersection for their solution and draw inference from their data.
Curated OER
Growing Circles
Students identify the equation to represent a circle. For this algebra lesson, students review properties of conics and how they are related. they use a robot to create a visual of circles and their application to the real world.
Curated OER
SAT Grid Practice Test 11
In this SAT practice test, students compute the area and perimeter of polygons. They determine the volume of a cylinder and solve problems with exponents. This one-page worksheet contains 10 problems. Answers are provided.
National Security Agency
Partying with Proportions and Percents
Examine ratios and proportions in several real-world scenarios. Children will calculate unit rates, work with proportions and percentages as they plan a party, purchase produce, and take a tally. This lesson plan recommends five...
Curated OER
Area Investigation
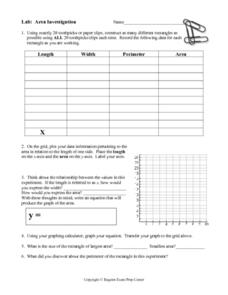
In this area investigation activity, 8th graders solve and complete 6 different problems that include complete a chart with given data and a graph. First, they construct as many different rectangles as possible using toothpicks. Then...
Curated OER
Quadratic Functions
In this algebra worksheet, learners factor quadratic equations and graph their resulting parabola. They relate quadratics to real life scenario. There are 20 questions with an answer key.
Curated OER
What are Fractals?
Middle and high schoolers identify and analyze fractals and research information using the Internet to locate information about them. They look at fractals in relation to nature and other real world situations. Pupils create several...
Curated OER
Systems of Inequalities
In this Algebra I/Algebra II worksheet, students determine the solution to a system of inequalities by graphing. The two page worksheet contains explanation, instruction, and four worked problems.
Curated OER
Cutting Cordwood
Students examine a story problem in which two men are earning money by cutting cords of wood. They use data from graphs to use on a grid. They practice writing algebraic equations as well.
Curated OER
Exponential Functions
In this algebra worksheet, students evaluate exponential functions using tables and graphs. There are 6 questions with an answer key.
Curated OER
Math Journal: Functions and Coordinate Geometry
Fifth graders examine the many uses of coordinate grids. In this graphing lesson, 5th graders write data driven equations, discuss the x and y-axis, and determine if using 2 or 3 ordered pairs is better. Students complete several...
Curated OER
Slope Fields
Students create and analyze slope fields. For this calculus lesson, students create a visual of differential equations. They use the Ti Navigator to create slope fields.
Alabama Learning Exchange
I'm Lovin' It: Finding Area Between Curves
Students explore the concept of finding the area between two curves. In this finding the area between two curves instructional activity, students model the logos of McDonalds, Nike, and Motorola on grid paper. Students find functions to...
Curated OER
Volume and Surface Area: Which Is More?
Students explore the volume and surface area of three dimensional figures. Through the use of video, students discover three dimensional shapes, their uses in real-life applications, and methods used to calculate their volume and surface...
Noyce Foundation
Pizza Crusts
Enough stuffed crust to go around. Pupils calculate the area and perimeter of a variety of pizza shapes, including rectangular and circular. Individuals design rectangular pizzas with a given area to maximize the amount of crust and do...
Georgia Department of Education
Math Class
Young analysts use real (provided) data from a class's test scores to practice using statistical tools. Not only do learners calculate measures of center and spread (including mean, median, deviation, and IQ range), but also use this...
Curated OER
Discovering Growth Patterns
Students explain the differences between linear (arithmetic) and exponential (geometric) growth. They use worksheets imbedded in this lesson to help them make predicitions and graph data points.
Curated OER
Exploring Slope
Students explore the physical aspect of a slope. In this algebra lesson, students graph a slope and write an equation for a slope. They identify slopes of zero, negative lines and positive lines.


