National Nanotechnology Infrastructure Network
The Effects of Gold and Silver Nanoparticles on Brine Shrimp: A Toxicology Study
Who doesn't love gold and silver? Brine shrimp, that's who! Learners conduct an experimental lesson to monitor the toxicity of gold and silver nanoparticles on brine shrimp. They synthesize solutions to expose the brine shrimp to and...
Baylor College
Body Mass Index (BMI)
How do you calculate your Body Mass Index, and why is this information a valuable indicator of health? Class members discover not only what BMI is and practice calculating it using the height and weight of six fictitious individuals, but...
UAF Geophysical Institute
Carbon Footprint
Your young environmentalists can calculate their carbon footprint and discuss ways to reduce it with a worksheet about climate change. After reading a handout about what impact one's carbon footprint can have on the environment, kids...
Curated OER
Little Auk Survival Challenge
A bird's life is one of danger and intrigue as it struggles for survival in sometimes harsh environments. To understand how difficult surviving in the wild can be, children play a simulation game where they act as little auks, birds from...
NASA
Development of a Model: Analyzing Elemental Abundance
How do scientists identify which elements originate from meteorites? Scholars learn about a sample of material found in a remote location, analyzing the sample to determine if it might be from Earth or not. They study elements, isotopes,...
NOAA
What Killed the Seeds?
Can a coral cure cancer? Take seventh and eighth grade science sleuths to the underwater drugstore for an investigation into emerging pharmaceutical research. The fifth installment in a series of six has classmates research the wealth of...
Georgetown University
Cup-Activity: Writing Equations From Data
Determine how cup stacking relates to linear equations. Pupils stack cups and record the heights. Using the data collected, learners develop a linear equation that models the height. The scholars then interpret the slope and the...
NASA
Climate Change Inquiry Lab
With global temperatures on the rise faster than ever recorded, the effects of a heating planet could be devastating. Allow learners to discover just what the world is in store for if the warming continues through a series of videos, a...
Chicago Botanic Garden
Carbon, Greenhouse Gases, and Climate
Climate models mathematically represent the interactions of the atmosphere, oceans, land, sun, surface, and ice. Part two in the series of four lessons looks at the role greenhouse gases play in keeping Earth warm and has participants...
WindWise Education
How Does a Generator Work?
I get a charge out of this. In order to learn how a generator works, groups build and test one in this ninth lesson of the series. The generators are tested at low speed and high speed to determine the watt output and whether they have...
Curated OER
Mathematics in Bioengineering: Its Application for Today's Students
High schoolers explore the different fields of bioengineering. They will create and interpret graphs from cancel cells data. They then calculate the amount of drugs found in blood and eliminated by the body over time.
Nuffield Foundation
Investigating Factors Affecting the Heart Rate of Daphnia
What variables change heart rate? Young scientists observe the beating heart in Daphnia to understand these variables. They make changes in temperature, chemicals, and other factors as they graph the heart rates. Analysis questions help...
Curated OER
Zebra Mussel Population Simulation
Students are taught how to format and enter data into an Excel spreadsheet. They make a graph, and interpret graphed data. Students discuss the possible impacts of zebra mussels on the Hudson river. They graph zebra mussel data.
Curated OER
Bycatch
Bycatch is the unwanted and discarded marine life caught during commercial fishing. Young marine scientists review bycatch litigation and analyze graphs of bycatch data and answer questions about it. This raises awareness while...
Curated OER
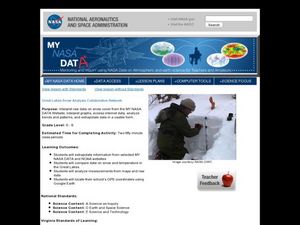
Great Lakes Snow Analysis Collaborative Network
Students interpret data on snow cover and analyze trend patterns. In this snow lesson students compare data and locate their school's GPS coordinates.
Curated OER
Bugs, Bugs, Everywhere!
Young scholars collect and compare bugs using magnifying lenses and graph data based on their comparisons. In this bugs lesson plan, students also make an aspirator by using a jar, tubing, and screen.
Curated OER
What's Cooking?
Young scholars investigate solar energy by making sun tea. In this ecology and solar energy lesson plan, students prepare traditional tea and "sun" tea, then record and graph data comparing color, clarity, smell and taste.
Curated OER
The Frozen Desert: Graphing and Comparing Climates
Students explore the concept of climate. They use temperature and precipitation data from their area and other regions to construct climate graphs. These graphs are used to help identify factors that influence climate.
Curated OER
Graphing the Diversity of a Forest
Second graders work in groups to identify what types of trees create which types of leaves In this plant life lesson plan, 2nd graders analyze a set of leaves and identify the tree it came from while graphing the data in a science...
Curated OER
Paper Airplane Science
Fifth graders recognize the need to follow the scientific method carefully and be aware of variables in experiments. In this airplane instructional activity, 5th graders design and test an airplane, and complete a data sheet....
Curated OER
Climographs
Learners identify trends and characteristics of climate zones and specific places within. Then, they graph annual climate trends (primarily Temperature and Precipitation) and create, interpret and extrapolate information based on...
Curated OER
Animal Skin
Students investigate the skin surface to body area ratios for different animals. In this seventh/eighth grade mathematics/science lesson, students explore heat transfer between an animal’s body and the environment. Using...
Curated OER
Collect Data Using a Transect Line
Learners learn about transect lines through a study of marine debris. In this marine debris instructional activity, students calculate the items on a transect line and graph them. Learners complete a category worksheet.
Curated OER
Testing for Vitamin C in Different Drinks and Foods
Students examine the importance of vitamin c in their diets and the sources that it comes from. In this vitamin lesson students complete hands on activities, interpret data and make a bar graph.


