Curated OER
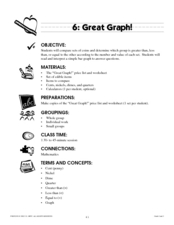
Great Graph!
Here is a fantastic lesson counting coins, interpreting graphs, and the concept of "greater than" and "less than." Young mathematicians utilize worksheets embedded in the plan in order to practice these concepts. The worksheets are...
EngageNY
Graphing the Logarithmic Function
Teach collaboration and communication skills in addition to graphing logarithmic functions. Scholars in different groups graph different logarithmic functions by hand using provided coordinate points. These graphs provide the basis for...
EngageNY
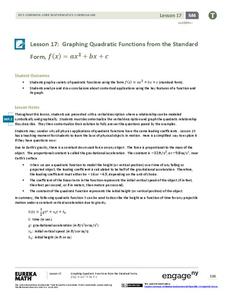
Graphing Quadratic Functions from the Standard Form
Use context to explain the importance of the key features of a graph. When context is introduced, the domain and range have meaning, which enhances understanding. Pupils use application questions to explore the key features of the graph...
Willow Tree
Circle Graphs
Pie isn't just for eating! Scholars learn to create pie charts and circle graphs to represent data. Given raw data, learners determine the percent of the whole for each category and then figure out the degree of the circle that percent...
National Math + Science Initative
Using Linear Equations to Define Geometric Solids
Making the transition from two-dimensional shapes to three-dimensional solids can be difficult for many geometry students. This comprehensive Common Core lesson plan starts with writing and graphing linear equations to define a bounded...
Curated OER
Making Connections: Matrices, Graph, Linear Systems
In this set of activities, matrices and equations are explored. They work with matrices using pen and paper as well as graphing calculator. Additionally real-world problems are explored.
Curated OER
Math Can Be Electrifying
Students explore how math can be used to calculate and analyze how electricity causes air pollution. Students design a campaign to educate family members on ways they can save electricity. They create a graph that compares two electric...
Curated OER
Graphing Linear Equations on the TI-73
Eighth graders work in pairs with a TI-73 graphing calculator to complete a multiple-choice review using the Classroom Performance System. Each team uses a remote unit to "click in" the answers. When all teams have completed the review,...
Virginia Department of Education
Transformational Graphing
Find relationships between the structure of a function and its graph. An engaging lesson explores seven parent functions and their graphs. Learners match functions to their graphs and describe transformations.
Virginia Department of Education
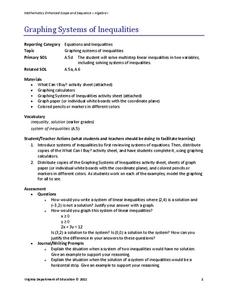
Graphing Systems of Inequalities
Apply systems of inequalities to a real-world problem. Here, scholars learn to graph solutions to systems of linear inequalities. To finish the lesson plan, they solve a problem involving burgers and cheeseburgers using a system of...
Curated OER
Trigonometry and the Calculator
In this geometry activity, 10th graders use a graphing calculator to evaluate trigonometric functions and their inverses. The four page activity contains explanation, examples, and twenty questions. Answers are not included.
Curated OER
Exploring Quadratic Data with Transformation Graphing
Using a data collection device to collect data regarding a bouncing ball, students use various features on graphing calculators to experiment with the parameters of the vertex form of the parabola and their effect on the shape of the...
Utah Education Network (UEN)
Linear Graphs Using Proportions and Rates
Using a TI-73 or other similar graphing calculator middle school math majors investigate the linear relationship of equivalent proportions. After a brief introduction by the teacher, class members participate in a timed pair share...
Corbett Maths
Area under a Graph
What? The calculation of area is a linear distance? A short video shows how to use the areas of simple polygons to estimate the area under a graph. Pupils divide the area under a curve into figures to easier calculate the area. Given...
EngageNY
The Line Joining Two Distinct Points of the Graph y=mx+b Has Slope m
Investigate the relationship between the slope-intercept form and the slope of the graph. The lesson plan leads an investigation of the slope-intercept equation of a line and its slope. Pupils realize the slope is the same as the...
Curated OER
What's in a Graph?
How many yellow Skittles® come in a fun-size package? Use candy color data to construct a bar graph and a pie chart. Pupils analyze bar graphs of real-life data on the Texas and Massachusetts populations. As an assessment at the end of...
Kid Zone
Groundhog's Day Graphing
This Groundhog's Day, challenge scholars to predict, estimate, tally, and graph in a weather-themed lesson in which class members play the role of the groundhog to forecast the weather come February second.
Curated OER
Middle Grades Math: Balancing Equations
Learners solve linear equations. By observing the graph of each side of an equation using the TI-nspire graphing calculator, your class gains insight into solutions, as well as balancing equations and transforming linear equations....
Curated OER
Exploring Graphs
Learners are introduced to connecting graphing in a coordinate plane to making scatterplots on a graphing calculator. Working in pairs, they connect points plotted to make a sailboat and complete questions on a worksheet as well as plot...
Curated OER
Graphing Calculator Activity
In this graphing calculator learning exercise, students explore the steps to analyze a complex fraction using a graphing calculator. They simplify a complex fraction to a proper fraction. This four page learning exercise contains...
Curated OER
Domian and Range of Graphs
High schoolers determine the domain and range of various graphs using a graphing calculator. Given a set of graphs to analyze, learners calculate the range and domain of the graphs by plotting the graphs on their calculators. Downloads...
Curated OER
The Coordinate Plane
Use this Saxon math coordinate plane worksheet to have your learners utilize a graphing calculator, equate the vertices of a rectangle, and then graph their conclusions as well as answer a variety of fill in the blank equations.
Curated OER
Interpreting Graphs
Sixth graders interpret linear and nonlinear graphs. They create graphs based on a problem set. Next, they represent quantitive relationships on a graph and write a story related to graphing.
EngageNY
Graphs of Linear Functions and Rate of Change
Discover an important property of linear functions. Learners use the slope formula to calculate the rates of change of linear functions. They find that linear functions have constant rates of change and use this property to determine if...


