Curated OER
Graph Club 2.0 Matching
Second graders study graphing using pictographs and bar graphs. They graph pie charts, line graphs, and also change the graph scale up to 1000. They use the pictograph on the left to create the same graph on the right using a bar graph.
Curated OER
Histograms and Bar Graphs
Students examine the use of bar graphs and histograms. In this data representation lesson, students investigate the proper use of bar graphs and histograms to represent data. They learn the proper geometric definitions, experience direct...
Curated OER
Graphing and Analyzing
In this graphing and analyzing worksheet, 9th graders first state if each graph represents a linear or nonlinear relationship. Second, they create a difference table for each set of data presented and determine whether it represents a...
Curated OER
Graphing Linear Equations
Ninth graders examine the applications for linear equations and their graphical displays. They observe a demonstration, solve problems independently, and play a computer game.
Curated OER
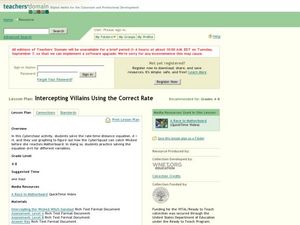
Intercepting Villans Using the Correct Rate
A Cyberchase video introduces the distance = rate x time equation. Participants then calculate answers to proposed problems and graph a series of results that is then incorporated into a game to help cement the concept. A thorough and...
Curated OER
Functions and Graphing
Graphing functions in a real world application makes math come to life. Learners graph points on a coordinate plane and identify various points on a graph by working through a set of real world problems. This is a perfect review exercise.
Curated OER
Graphing and Interpreting Linear Equations in Two Variables
Graph linear equations using a table of values. Learners solve equations in two variables using standard form of an equation. They identify the relationship between x and y values.
EngageNY
Transforming Rational Functions
Move all rational functions—well, maybe. Learners investigate the graphs of the reciprocals of power functions to determine a pattern between the graph and the power. Pupils graph rational functions where transformations are clearly...
Flipped Math
Unit 5 Review: Systems of Equations
Activate transformers along with algebra systems. Pupils use 10 problems to review transformations of functions to solve a variety of systems of equations. Individuals identify the types of transformations from an equation along with...
Curated OER
Graphs
Students investigate circle and bar graphs. In this middle school mathematics instructional activity, students determine which kind of graph is suitable for a given situation and create circle and bar graphs.
Illustrative Mathematics
Bike Race
A graph not only tells us who won the bike race, but also what happened during the race. Use this resource to help learners understand graphs. The commentary suggests waiting until the end of the year to introduce this topic, but why...
Teach Engineering
Complex Networks and Graphs
Show your class how engineers use graphs to understand large and complex systems. The resource provides the beginnings of graph theory by introducing the class to set theory, graphs, and degree distributions of a graph.
Curated OER
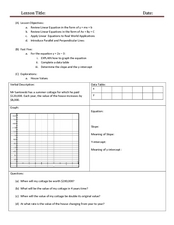
Review Linear Equations
Explore algebra I/algebra II with this series of worksheets. Pupils write linear equations in slope-intercept and standard form, graph linear equations, and apply linear equations to real world applications. The six-page learning...
Curated OER
Exploring Quadratic Data with Transformation Graphing
Using a data collection device to collect data regarding a bouncing ball, students use various features on graphing calculators to experiment with the parameters of the vertex form of the parabola and their effect on the shape of the...
Curated OER
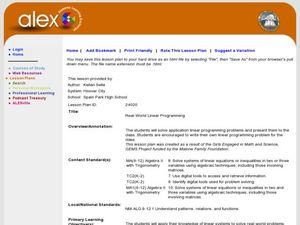
Real-World Linear Programming
Explore linear programming on a website game. Partners solve a real-world problem by setting up an objective function and a linear inequality. They graph their results on chart paper and also using a calculator before presenting their...
Curated OER
Systems of Equations and Inequalities
This is a comprehensive lesson on creating and solving equations and systems of equations and inequalities. Problems range from basic linear equations to more complex systems of equations and inequalities based on a real-world examples....
Curated OER
Linear Programming
Students explore inequalities to determine the optimal solution to maximize a profit for a company. In this linear programming lesson, students discover how to graph inequalities and how to determine the algebraic representation of a...
Curated OER
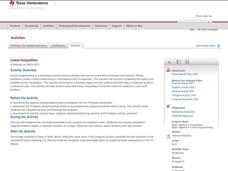
Linear Inequalities
Through exploration of linear programming through graphs and equations of inequalities, students relate linear programming to real life scenarios, such as business. Graphing and shading is also part of this exercise.
Curated OER
Explore Learning Exponential Functions
High schoolers graph exponential equations and solve application problems using exponential functions. They re-enact a story about a peasant worker whose payment for services is rice grains doubled on a checker board. They place M &...
Curated OER
Point-Slope Form of a Line
This activity helps young mathematicians connect the graph and the point-slope form of a line, by first solving a real-world problem and then using that example to motivate the understanding of the equation. By manipulating the gizmo,...
Curated OER
Linear Programming
In this linear programming worksheet, students solve and complete 6 different word problems related to programming. First, they define the variables in each problem and write a system of inequalities. Then, students graph the...
Curated OER
Statistics Canada
Young scholars practice using graphing tools to make tables, bar charts, scatter graphs, and histograms, using census data. They apply the concept of measures of central tendency, examine the effects of outliers. They also write...
Curated OER
Slope, Vectors, and Wind Pressure
A hands-on lesson using the TI-CBR Motion Detector to provide information to graph and analyze. The class uses this information to calculate the slope of motion graphs and differentiate scalar and vector quantities. There is a real-world...
Curated OER
Speed
Fifth and sixth graders practice working in pairs to determine whether they can walk with constant speed. They test themselves, collect their data, draw graphs with their data collected, manipulate the data, and then draw conclusions...


