Intel
What Does This Graph Tell You?
What can math say about natural phenomena? The fifth STEM lesson in this project-based learning series asks collaborative groups to choose a phenomenon of interest and design an experiment to simulate the phenomenon. After collecting...
Kenan Fellows
Balancing Equations Using Matrices
Matrices help solve systems of equations in chemistry, computer graphics, circuitry, probability, and more. The second lesson in a seven-part series focuses on using matrices to balance chemical equations. Pupils rely on the Law of...
Curated OER
Technology: Programming Graphics
Students use the DrScheme program to create graphics for clip art. Using graphics, they plan their designs using basic shapes, plotting its positions, and studying the relationships between points. By plotting the necessary data on...
Curated OER
Relationship of Angles
A direct, graphically clean practice sheet for identifying complementary, supplementary, and vertical angles. Given a diagram, learners simply write the correct designation on the line. Six problems are presented.
Illustrative Mathematics
Roll & Build
Develop young mathematicians' understanding of place value with this hands-on math activity. Working in pairs, learners take turns building two-digit numbers by rolling two ten-sided dice. Base ten blocks are then used to model the...
Curated OER
Reading for Life
Imagine a packet packed with reading resources designed for every grade and reading level. Imagine worksheets, graphic organizers, flash cards, activities, and exercises. This is just such a packet and is well worth downloading,
Curriculum Corner
Problem Solving Cards
Twelve cards and a worksheet make up an activity designed to reinforce problem solving skills. Scholars read and solve a variety of word problems using a graphic organizer to show their work.
Curated OER
Maximize It!
Students design a rectangular box without a lid that has the largest possible volume using the supplied sheet of centimeter graph paper. They work in groups to construct different size boxes to determine the largest possible volume and...
Curated OER
Quilting Geometry
Study geometry through the concept of quilt design. High schoolers examine the geometric shapes in various quilts and then create their own quilts using geometric shapes that fit together. In the end, they write a paragraph to describe...
Curated OER
Virtual Field Trip
This hands-on resource has future trip planners analyze graphs of mileage, gasoline costs, and travel time on different routes. While this was originally designed for a problem-solving exercise using a Michigan map, it could be used as a...
Curated OER
It's in Your Pocket
Students examine American coins. In this American currency lesson, students study how American money came to be as well as the responsibilities of the U.S. Mint. Students discover details regarding American coins and design their own coins.
Curated OER
Graphic Pictures
In this math activity, students are asked to use 4 different colors and create a picture on a graph. There are 2 questions with no answer key.
Alabama Learning Exchange
I Know What You Did Last Summer: A Data Graphing Project
Young scholars participate in graphing data. In this graphing data instructional activity, students make a stem and leaf plot of their summer activities. Young scholars create numerous graphs on poster boards. Students discuss the...
Curated OER
Geometric Illusion Banners
Students explore the composition of 3-D optical illusions by analyzing and combining 2-D visual elements graphically in banner form. They dissect the designs to undercover the mathematical elements of the illusion.
Little Bit Studio
Bugs and Buttons 2
Playing with bugs and buttons has never been so much fun! Offering a variety of different activities, this is a great resource for developing basic skills in preschool and kindergarten-aged children.
Education Outside
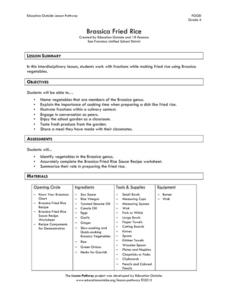
Brassica Fried Rice
Here's a delicious way to engage fourth graders into working with fractions. Kids chop brassica or cruciferous vegetables, measure the required ingredients, and add them to cooked rice to produce a delicious treat.
Super Teacher Worksheets
Counting Memory Match Game
What a fun way to practice counting! Print these cards for an easy go-to matching game. Partners take turns playing a memory game, flipping the cards over to try to match a number with the card that has the corresponding number of...
Curated OER
Manipulative Mania
Learners explore tangram vocabulary and tangram designs, creating an art design that contains various geometric parts. They complete a checklist titled, Important Thing About a Quilt Design.
Curated OER
Ge-Oh Boy, Oh Boy
Students listen to the book, Sam Johnson and the Blue Ribbon Quilt and discuss the art of quilting. They examine various symmetrical sewing designs, and identify reflection pieces, slides, and flips.
Curated OER
Nickels, History, and Peace
Second graders examine the designs on nickels before 2004 and after when the new Peace Medal nickel was minted. They research the events that preceded the new design and explore the symbols of friendship on the new coin. They work in...
Curated OER
Data, Data, Everywhere... and What Am I To Think?
Students demonstrate good random sampling techniques for data collection, select and develop graphic presentations of data and analyze the data to solve a problem presented.
Curated OER
How Fast Is Your Car?
Eighth graders discover the relationship between speed, distance, and time. They calculate speed and represent their data graphically. They, in groups, design a ramp for their matchbox car. The goal is to see who's ramp produces the...
Curated OER
Science of Special Effects
This is a creative, multidisciplinary, well-designed lesson provided by Scientific American related to special effects. Students make their own animated short films and use math and computer skills.
Other popular searches
- Graphic Design Lessons
- Graphic Design Principles
- Graphic Design Packaging
- Teaching Graphic Design
- Graphic Design Typography
- Graphic Design Logo
- Graphic Design Posters
- Art Graphic Design
- Graphic Design Art Lessons
- Graphic Design Jobs
- Graphic Design Movie Poster
- Graphic Design Cd Covers


