Curated OER
Chucky Chickadee's Bird and Breakfast: Sing in Please
Students observe bird feeding and complete a tally and graphing activity for their observations. In this bird graphing lesson, students work in teams to observe bird feedings. Students complete a bird reporting sheet and collect data...
Curated OER
Mira: Activity 10
Students read the story, Mira and then draw a picture of their favorite weather using the story as a background. They post their pictures around the room and make a tally chart of the number of pictures that were drawn with various...
Curated OER
Bellwork for Week 11
In this bellwork instructional activity, students answer questions about chemical and mechanical weathering, particle size, and the soil profile at the start of class.
Curated OER
The Lake Effect
Fourth graders conduct an experiment demonstrating the effects of water and air temperature on precipitation. They create graphs demonstrating their findings using Claris Works for Kids.
Curated OER
Data Analysis 2
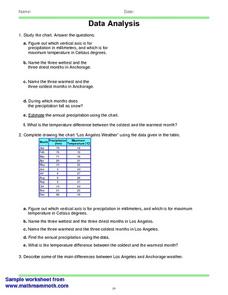
In this data analysis learning exercise, students read and interpret given line graphs. They determine the range and average. This one-page learning exercise contains five problems.
Curated OER
Temperature
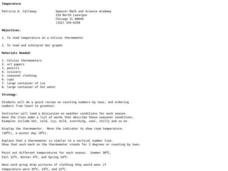
Students explore the concept of temperature. In this temperature instructional activity, students read thermometers in degrees Celsius. Students discuss the temperature of the seasons and what clothing they might wear given a certain...
Curated OER
Population and Population Density
Students read and interpret graphs. In this population activity, students explore population and population density as they read several data graphs and respond to questions.
Curated OER
The Blizzard of 1993
Students read and interpret the information from a barograph from a major winter storm. This task assesses students' abilities to interpret and analyze graphs, construct data tables and graphs, generalize, infer, apply knowledge of...
Curated OER
Weather Conditions During the Fall Monarch Migration
Students keep detailed weather records during the fall migration of the monarch butterfly. They compare weather conditions to the days they do and do not see monarchs. As a class, they graph and analyze data and send it to a university...
Curated OER
Using Radiosonde Data From a Weather Balloon Launch
Student use radiosonde data from a weather balloon launch to distinguish the characteristics of the lower atmosphere. They learn the layers of the atmosphere. They graph real atmospheric data.
Curated OER
Weather Conditions During the Spring Monarch Migration
Students keep detailed weather records during the spring migration of the monarch butterfly. To keep track of the weather, students utilyze weather reports and instuments such as anemometers, compasses, thermometers and rain gauges.
Curated OER
Scientific Graphs
Students organize data collected from their experiments using graphs. In this statistics and biology lesson, students organize their scientific data from an article into readable graphs. They define the usefulness of their graph and...
Curated OER
Graphing Climate Information
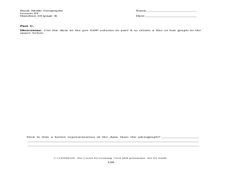
Seventh graders plot the data for the average monthly precipitation for three cities. They make a graph using a spreadsheet.
Curated OER
The Weather and Recess #157
Students track the daily weather at recess time for a number of weeks. They design a bar graph of the different types of weather. They discuss how weather changes affect recess time. They write a list of optional recess activities for...
Curated OER
Weather Around the World
Students learn a few key weather terminology and a variety of climates through examining and recording weather characteristics in a variety of communities around the world.
Curated OER
Investigation 7 - Interpreting Weather Data
Fourth graders interpret the weather data they gathered in Investigation 6. They take an average of each component in each season. They compare the same components of each season and write the differences they see between the seasons.
Curated OER
Chart the Weather for Cities Around the World
Students orally describe Northern and Southern hemispheres, identify 7 continents, and point out specific countries and cities. They locate and record weather information.
Curated OER
Weather Plots
Students investigate the relationship between temperature and humidity. The graphs of weather data gathered and plotted for for an assigned period of time are analyzed and the interpretations shared with the class.
Curated OER
Student Weather Journal
Students recognize different types of cloud patterns and associate these patterns with certain types of weather. They predict the weather for the next 6 to 24 hours. They then improve their observation skills as they check on the weather...
Curated OER
Graphing Data - Temperature
Seventh graders measure and record temperature over a given time period. They compare the recorded temperatures to the 40-year recorded normal average temperatures for the same area. Students display and interpret their findings in a graph.
Curated OER
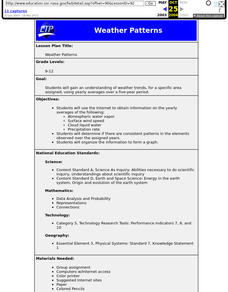
Weather Patterns
Students use yearly averages over a five-year period to understand weather trends for a specific area.
Curated OER
Wet Weather, Wet Climate
Students discover the differences between weather and climate in this long-term lesson introduction. They create rain gauges and practice reading rainfall measurements, view a website showing the cloud cover in their location and draw...
Curated OER
Gathering Weather Information
Students watch a video of a recent weather disaster. Using the internet, they work together to examine the weather forecast for tomorrow and next week and discuss why it is important to know the weather. In groups, they use weather...
Other popular searches
- Weather Graph
- Kindergarten Weather Graph
- Fall Weather Graph
- Daily Weather Graph
- Culture Weather Graph
- Graph Weather Chart
- Weather Graph Template
- Weather Graph Paper
- Math Data Graph Weather
- Weather Graph 1st Grade
- Local Weather Graph
- Local Weather Line Graph


