Curated OER
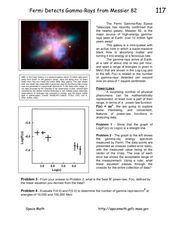
Fermi Detects Gamma-Rays from Messier
In this power law function worksheet, students use data from the Fermi Gamma-Ray Space telescope to apply the power law function to physical phenomena. Students use a graph to solve four problems.
Curated OER
Get a Half-Life!: Student Worksheet
In this math/science worksheet, learners will work in pairs to conduct an experiment based on a decay function which is often used to model radioactive decay. Students will shake M & M's in a cup to rub off the M and then record...
Curated OER
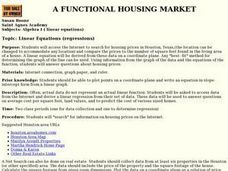
A Functional Housing Market
Students access the Internet to search for housing prices in Houston, Texas,(the location can be changed to accommodate any location) and compare the prices to the number of square feet found in the living area of a house.
Ms. Amber Nakamura's Mathematics Website
Algebra Project
What would your dream house look like? A cottage? A medieval castle? High schoolers enrolled in Algebra design the perfect house while using slopes to write equations for various aspects of the project.
Curated OER
Sums and Difference of Cubes
Learners factor polynomials using the sum and difference of cubes. They also learn connections between the graph and expression.
Del Mar College
Finding the Domain
Domain to a math teacher makes perfect sense, but it can seem like gibberish to high schoolers. As it is laid out in clear terms, domain is introduced and explained among all types of functions throughout the handout. The first three...
EngageNY
Arithmetic and Geometric Sequences
Arithmetic and geometric sequences are linear and geometric patterns. Help pupils understand the relationship and see the connection with an activity that asks them to write the rules and classify the patterns correctly. A sorting...
Curated OER
Further Differentiation
In this further differentiation worksheet, students solve and complete 7 various types of problems. First, they sketch the graph of each equation using a stationary point. Then, students find the stationary points of each and describe...
Inside Mathematics
House Prices
Mortgages, payments, and wages correlate with each other. The short assessment presents scatter plots for young mathematicians to interpret. Class members interpret the scatter plots of price versus payment and wage versus payment for...
Radford University
A Change in the Weather
Explore the power of mathematics through this two-week statistics unit. Pupils learn about several climate-related issues and complete surveys that communicate their perceptions. They graph both univariate and bivariate data and use...
EngageNY
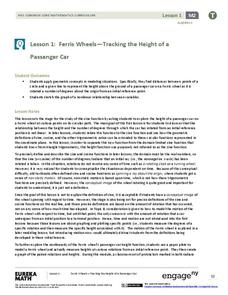
Ferris Wheels—Tracking the Height of a Passenger Car
Watch your pupils go round and round as they explore periodic behavior. Learners graph the height of a Ferris wheel over time. They repeat the process with Ferris wheels of different diameters.
Curated OER
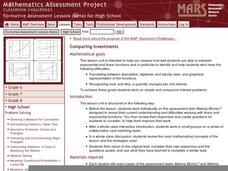
Comparing Investments
Money, money, money. A complete lesson that makes use of different representations of simple and compound interest, including written scenarios, tables, graphs, and equations to highlight similarities and differences between linear and...
West Contra Costa Unified School District
Derivative – Standard Definition
Making a clear connection to algebra concepts helps learners understand the definition of a derivative. The lesson plan begins with looking at limits of simple linear and rational functions, and leads to the definition of...
Curated OER
Direct and Inverse Variation
Eighth graders participate in two data collection activities that involve direct and inverse variation. In the pre-assessment, 8th graders categorize numerical, graphical, and verbal representations as linear or nonlinear and determine...
Curated OER
Water in the Texas Coastal Basins
Students, after researching a Texas coastal basin, map and graph the information they collect and then translate it into a short report to be presented to their classmates. They brainstorm unique ways to maintain Texas estuaries as well...
Curated OER
Taxi!
Your young taxi drivers evaluate and articulate the reasoning behind statements in a conceptual task involving linear data. The given data table of distances traveled and the resulting fare in dollars is used by learners to explore...
Curated OER
Introduction to Solving Quadratic Equations by Factoring
Learners solve quadratic equations. In this algebra lesson plan, students factor and graph linear and quadratic functions. They identify the standard and linear form of each equation.
American Statistical Association
Scatter It! (Predict Billy’s Height)
How do doctors predict a child's future height? Scholars use one case study to determine the height of a child two years into the future. They graph the given data, determine the line of best fit, and use that to estimate the height in...
02 x 02 Worksheets
Factoring
Factor in this resource when teaching how to factor polynomials. Scholars use algebra tiles to factor linear and quadratic expressions. They practice their skill by working on example problems from a worksheet.
Curated OER
Lines, Rays, Line Segments, and Planes
Students are introduced to lines, rays, line segments and planes. They explore the differences between lines, rays, line segments and planes. Students pracice graphing lines, rays, line segments and planes.
Project Maths
Integral Calculus
From derivatives to antiderivatives and back again. Building on the second lesson of the three-part series covering functions, learners explore the concept of an antiderivative. They connect the concept to the graph of the function and...
Curated OER
Algebra 1: Slope as Rate
Students solve problems with slopes. In this algebra lesson, students identify the slope of a line and relate it to the rate of change. They graph their lines on the TI and observe changes in the lines.
Curated OER
Linear Equations
In this Algebra I/Algebra II worksheet, students write the equation of a line given the coordinates of two points on the line. The one page worksheet contains a combination of three multiple choice and free response...
Curated OER
Round and Round and Round We Go!
Students investigate motion using a CBL. In this algebra lesson, students collect and graph data on a coordinate plane. They define and identify amplitude and period of conic graphs.
