Curated OER
Chairs Around the Table
Youngsters become flexible problem solvers with this challenging lesson. If there are 24 square tables in a restaurant, how many customers can be seated at one time? They can use manipulatives or draw pictures to help them find the...
Charleston School District
Review Unit 4: Linear Functions
It's time to show what they know! An assessment review concludes a five-part series about linear functions. It covers all concepts featured throughout the unit, including linear equations, graphs, tables, and problem solving.
Virginia Department of Education
Graphing Linear Equations
Combine linear equations and a little creativity to produce a work of art. Math scholars create a design as they graph a list of linear equations. Their project results in a stained glass window pattern that they color.
EngageNY
Linear Functions and Proportionality
Connect linear equations, proportionality, and constant rates of change to linear functions. Young mathematicians learn how linear equations of the form y = mx + b can represent linear functions. They then explore examples of linear...
Curated OER
Graph Functions with Integers
Fifth graders can do a quick review of graphing functions using integers with this activity. The activity has questions which require students to identify the pertinent information in a word problem, and create a graph to represent the...
Curated OER
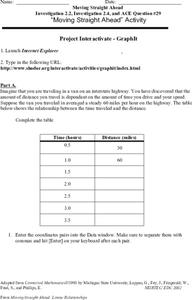
Moving Straight Ahead
In this functions worksheet, 9th graders solve and complete 24 various types of problems. First, they complete the table with the correct distance for each hour given. Then, students enter the coordinate pairs into the function table...
EngageNY
From Ratio Tables, Equations and Double Number Line Diagrams to Plots on the Coordinate Plane
Represent ratios using a variety of methods. Classmates combine the representations of ratios previously learned with the coordinate plane. Using ratio tables, equations, double number lines, and ordered pairs to represent...
Curated OER
Exercise Set 1.5: Inverse Functions
In this inverse functions worksheet, students review inverse functions. They solve 66 questions. Problems cover a wide variety of types. Students graph functions and their inverses, they identify one-to-one functions and the domains and...
Utah Education Network (UEN)
Linear Relationships: Tables, Equations, and Graphs
Pupils explore the concept of linear relationships. They discuss real-world examples of independent and dependent relationships. In addition, they use tables, graphs, and equations to represent linear relationships. They also use ordered...
Curated OER
Identify and Graph Linear Equations
Students investigate linear functions. In this mathematics lesson plan, students plot points onto a graph by solving the equations y=x and y=mx+b by being given numbers for x and solving for y.
Curated OER
Functions and Graphing
Graphing functions in a real world application makes math come to life. Learners graph points on a coordinate plane and identify various points on a graph by working through a set of real world problems. This is a perfect review exercise.
Curated OER
When Ants Fly
Here is a great lesson on constructing line graphs. Learners identify common characteristics of birds, ants common needs of all living things. They also write a story from the perspective of an ant or a bird that has lost its home and...
Curated OER
Graph Functions: Practice
In this graph functions worksheet, students complete several activities to help them graph functions. Students use the table and the graph to complete the questions. Students also answer two test prep questions.
Curated OER
Representation of Quadratic Functions
Students use a table, graph or equation to represent a quadratic function. In this algebra lesson, students model and graph with quadratic function. They become comfortable representing quadratics using different methods.
Curated OER
Graphing and Interpreting Linear Equations in Two Variables
Graph linear equations using a table of values. Learners solve equations in two variables using standard form of an equation. They identify the relationship between x and y values.
Curated OER
Student Costs Data Table
Young scholars compare and contrast two routes selected for a virtual field trip. They create a data table of educational activities, lodging, and meal costs using Microsoft Excel software.
Curated OER
Function Tables
In this graphing instructional activity, students complete two different word problems by filling out the function tables and then writing an algebraic equation for the problems.
Curated OER
Interpreting Graphs
Sixth graders interpret linear and nonlinear graphs. They create graphs based on a problem set. Next, they represent quantitive relationships on a graph and write a story related to graphing.
Curated OER
Function Tables
Pupils identify function using tables of data. In this algebra activity, students create a tale of point and plot on a coordinate plane. They analyze the graph as being a function or not.
EngageNY
Graphs of Linear Functions and Rate of Change
Discover an important property of linear functions. Learners use the slope formula to calculate the rates of change of linear functions. They find that linear functions have constant rates of change and use this property to determine if...
Mathematics Vision Project
Linear and Exponential Functions
Provide a continuous progression to linear and exponential functions. Pupils continue to work with the discrete functions known as sequences to the broader linear and exponential functions. The second unit in a series of nine provides...
Willow Tree
Line Graphs
Some data just doesn't follow a straight path. Learners use line graphs to represent data that changes over time. They use the graphs to analyze the data and make conclusions.
Curated OER
Guess My Rule (Function Tables)
Seventh graders recognize and solve functions. To reinforce the solving of word problems, 7th graders play a guessing game where they try to identify the functions used. They complete worksheets and draw graphs to match the problem in...
Curated OER
Using Parallel Axes To Discover Mathematical Interconnections
In this math worksheet, students graph the functions on parallel axes and observe the location of the slope point in relation to the x and y axes.


