Alberta Learning
Area and Perimeter of Irregular Shapes
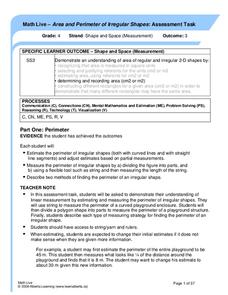
Evaluate young mathematicians' understanding of area and perimeter with this series of three assessment tasks. Challenging students to not only calculate the area and perimeter of irregular shapes, but to explain in writing their...
Curated OER
Discovering New Mexico
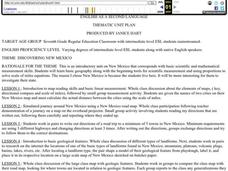
Seventh graders discuss the elements of maps and using basic linear measurement. They calculate the distance between the cities and create a simulated journey around New Mexico using a road map. They write out the directions for their...
Curated OER
It's a Drag!
Students create number lines using decimals and whole numbers. In this algebra lesson, students graph and solve linear equations. They plot ordered pairs on a coordinate plane correctly.
EngageNY
Complex Numbers and Transformations
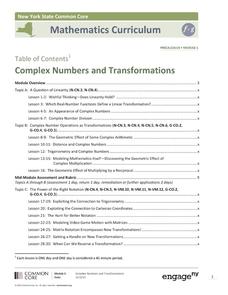
Your learners combine their knowledge of real and imaginary numbers and matrices in an activity containing thirty lessons, two assessments (mid-module and end module), and their corresponding rubrics. Centered on complex numbers and...
Curated OER
Practice: Word Problems
Congratulations, you've just hit the word problem jackpot! Covering an incredible range of topics from integers and fractions, to percents, geometry, and much more, this collection of worksheets will keep young mathematicians...
Curated OER
Math: Methods of Measurement
Fourth graders practice linear measurement skills by applying various measuring instruments to determine the heights of classmates. By measuring the heights of second graders and fourth graders, they construct tables of height and age...
Curated OER
Discovering the Linear Relationship between Celsius and Fahrenheit
Learners discover the linear relationship between degrees Farenheit and degrees Celsius. They manually compute the slope and y-intercept of the line passing through points. They convert Celsius to Fahrenheit degrees.
Curated OER
Robo-Pull
Students solve linear equations using two steps. In this algebra lesson, students add, subtract, multiply and divide to solve linear equations. They apply concepts of equations to a robot pulling cargo.
Curated OER
Olympic Games - Can You Measure Up?
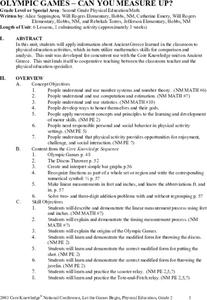
Students complete 6 units to learn about Ancient Greece and the Olympic games through physical education activities as well as math activities. In this Ancient Greece lesson, students complete multiple activities in 6 lessons including...
Curated OER
Correlation of Variables by Graphing
Middle and high schoolers use a spreadsheet to graph data. In this graphing lesson, learners determine how two parameters are correlated. They create a scatter plot graph using a computer spreadsheet.
Teachers Network
A World of Symmetry: Math-Geometry
Define and identify the three basic forms of symmetry translation, rotation, and glides with your class. They cut out and arrange paper pattern blocks to illustrate symmetry, create a Cartesian graph, and design a rug with a symmetrical...
Curated OER
Length, Perimeter and Area
Learners analyze characteristics and properties of two- and three-dimensional geometric shapes and develop mathematical arguments about geometric relationship
Curated OER
ExplorA-Pond: 4th Grade Perimeter Estimation
Your geometers are used to finding the perimeter of a square or rectangle, so give them something different this time! With this instructional activity, small groups will receive a picture of a shoreline and calculate the perimeter. The...
Curated OER
High School Mathematics Problems from Alaska: Stanley Jonas Travel Problem
Students convert from one system of linear measure to another, graphing data from a table to a coordinate graph, using a graph to make predictions.
Curated OER
Geometry and Shapes
High schoolers discuss and identify polygons and lines. In this geometry lesson plan, learners review liner, square and cubic units so they can incorporate it into the lesson plan on measurement and creating packing that are cost effective.
Curated OER
Celsius to Fahrenheit
Students convert degrees between two different units. In this algebra lesson, students graph linear equations and identify the line of best fit. They use their line of best fit to make predictions given a set of data.
Curated OER
Slopes and the Equation of a Line
In this slope and the equation of a line activity, 9th graders solve 15 various types of problems that include determining the slope of a line segment and determining the equation of line when two points on the line are presented. They...
Curated OER
Transformations and Matrices
There are four activities in this extensive lesson plan covering the identity matrix and scaling, the linear representation of translations, the linear representation of rotations, and reflections. In small groups, they use the Cabri II...
Curated OER
French Fry Run
Student explore estimation and measurement. In this measurement lesson, 2nd graders measure french fries, graph their data, and determine the size of french fries that is the best value. Students practice how to add prices and calculate ...
Hawaiʻi State Department of Education
Railroad Tracks
Ahhh the vanishing point! Sounds ominous, but it's not. Fifth graders analyze the use of perspective in Renaissance art. They practice using linear perspective to draw railroad tracks that seem to go on forever. Tip: Make this...
Curated OER
Metric Rhyme
Learners identify various units of measurement. In this measurement activity, students learn several chants that combine metric vocabulary words and actions to reinforce the concepts learned.
American Statistical Association
You and Michael
Investigate the relationship between height and arm span. Young statisticians measure the heights and arm spans of each class member and create a scatter plot using the data. They draw a line of best fit and use its slope to explain the...
American Statistical Association
How Tall and How Many?
Is there a relationship between height and the number of siblings? Classmates collect data on their heights and numbers of brothers and sisters. They apply statistical methods to determine if such a relationship exists.
Virginia Department of Education
Lines and Angles
Explore angle relationships associated with transversals. Pupils construct parallel lines with a transversal and find the measures of the angles formed. They figure out how the different angles are related before constructing...
