Curated OER
Surveying During a Basketball Game
Tenth graders conduct a survey at a high school basketball game. They compile and present the data as histograms or bar graphs.
Curated OER
Badminton or Basketball?
Learners explain why for a group of n people, there are an equal number of possibilities for subgroups of size k (such that k < n) and size n - k.
Curated OER
Hoops
With a creative premise involving a basketball competition, this game could be used to review basic science, grammar and math concepts in a fourth or fifth grade classroom. It is a fun idea, and a motivating way to review information....
Curated OER
Percentages in Word Problems
Eighth graders, after brainstorming all the places they see percentages in every day life (sales, basketball, grades, etc.), calculate percentages from bases and parts in word problems. They review their notes together on percentage...
Curated OER
Pictures and Fractions
In this fractions and pictures worksheet, 2nd graders draw and write what fraction of the boxes are yellow, butterflies are blue, balls that are basketballs, animals that are ducks and what fraction of the blocks are black.
Curated OER
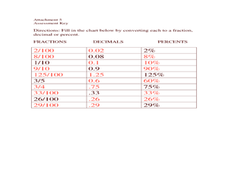
Convert among decimals, fractions, and percents
Seventh graders convert among decimals, percents, and fraction with and without a calculator. For this seventh grade mathematics lesson, 7th graders explore strategies that help them to remember how to perform the needed operation...
Curated OER
Paper Toss Shootout
Young scholars explore the concept of percentages. In this math lesson, students throw paper at wastebaskets as if shooting a basketball in a hoop. Young scholars shoot the paper a given amount of times and then calculate their shooting...
Scholastic
Study Jams! Bar Graphs
Mia teaches Sam how to create a bar graph, including forming a title, creating and labeling the axes, choosing a scale, and entering data. After viewing, data analysts can test themselves with seven follow-up questions and review...
Curated OER
The Basketball Tournament
Students estimate how many games are played if six teams play each other once. They investigate their own way and discuss possible strategies they might use. They then share their findings with the class.
Curated OER
The Fraction Race
The students participate in a game involving a hula hoop and basketballs. After each student participates in the activity, they write their game score in fraction form using the points they earned over the points possible.
Curated OER
Making Math Meaningful in March Madness
Pupils examine the statistics of March Madness, the college basketball tournament. They watch videotaped basketball games to collect data for further analysis using Word and Excel. They analyze the data in a variety of activities during...
Curated OER
Mavericks and Measurement
Students study the measurement formulas for area and perimeter in real-life situations. In this area and perimeter instructional activity, students design a bed and arrange furniture in a hotel room using area and perimeter formulas for...
Curated OER
Fitness Math
Students participate in physical fitness activities. They role a dice and perform the activity associated with the dice number. Activities include push ups, toe touches, curl ups, jump rope, jumping jacks, sit-ups, and shooting a...
West Contra Costa Unified School District
Comparing Data Displays
There is so much more to data than just numbers, and this resource has learners use three methods of comparing data in a multi-faceted lesson. The 21-page packet includes a warm-up, examples, an activity, and assessment for a complete...
EngageNY
Linear Equations in Two Variables
Create tables of solutions of linear equations. A lesson has pupils determine solutions for two-variable equations using tables. The class members graph the points on a coordinate graph.
EngageNY
Describing a Distribution Displayed in a Histogram
The shape of the histogram is also relative. Learners calculate relative frequencies from frequency tables and create relative frequency histograms. The scholars compare the histograms made from frequencies to those made from relative...
EngageNY
Introduction to Simultaneous Equations
Create an understanding of solving problems that require more than one equation. The lesson introduces the concept of systems of linear equations by using a familiar situation of constant rate problems. Pupils compare the graphs of...
EngageNY
Conducting a Simulation to Estimate the Probability of an Event II
Add some randomization into simulations. The 11th installment in a series of 25 presents two new methods to use in simulations--colored disks, and random numbers. Pupils use random numbers to run simulations where the probabilities make...
EngageNY
Creating a Histogram
Display data over a larger interval. The fourth segment in a 22-part unit introduces histograms and plotting data within intervals to the class. Pupils create frequency tables with predefined intervals to build histograms. They describe...
Curated OER
Arc of Ball To Make Basket
Pupils examine the mathematical relationship in scoring a basket. They observe the arc of the ball as it travels to the basket from different points on the floor.
Curated OER
Shapes
Students practice identifying spheres, triangles, and rectangles and the difference between plane shapes and space shapes. They identify shapes in the classroom and complete activity sheets.
Curated OER
Understanding Proportions and Scale Drawings
Proportions are ratios found using multiplication or division. Middle schoolers solve measurement problems, find a figure's missing dimension, and find the distance between two points. Resource features four lesson plans with detailed...
Curated OER
Scatter-Brained
Seventh graders graph ordered pairs on a coordinate plane. They create a scatterplot. Additionally, they determine the line of best fit and investigate the slope of the line. Multiple resources are provided. An excellent resource!
Willow Tree
Data Sampling
Some say that you can make statistics say whatever you want. It is important for learners to recognize these biases. Pupils learn about sample bias and the different types of samples.


