Google
Graphing with Google Docs & Forms
Get to know your class and teach about data analysis all with the help of Google Docs. Using student-generated questions, create a class survey using Google Forms. Reserve time in the computer lab for learners to complete the form and,...
Teach Engineering
Projections and Coordinates: Turning a 3D Earth into Flatlands
Introduce your class to map projections and coordinates, the basics for the work done in a GIS, with an activity that uses Google Earth to challenge learners to think about the earth's shape.
Curated OER
Money Makes the World Go Around
Students convert currency from around the world. For this math lesson, students solve exchange rate problems using Google Earth. They complete a worksheet during the simulation.
Council for Economic Education
Understanding a Balance Sheet
Read any financial website or book, and it is bound to discuss the words asset and liability. But what do these words actually mean to the class? The resource effectively explains by using multiple formats and techniques, including...
NASA
Revising an Investigation
Write, edit, and then revise! The fourth lesson plan in a five-part series asks peers to provide feedback on research. Individuals then use the research to edit and revise conclusions and develop their presentations.
Statistics Education Web
First Day Statistics Activity—Grouping Qualitative Data
Making groups of groups can help to organize data. Classes use statistics to group themselves using descriptive adjectives. The objective is for learners to understand that grouping qualitative data is useful when the original groups are...
Google
History of Math Lesson Plan
Learners honor mathematicians who have contributed important discoveries throughout history by researching and creating a report about a famous mathematician and their contributions to the history of mathematics. Pairs of learners...
Curated OER
A Full Load
Students calculate the shipping costs between two destinations. In this math lesson, students determine the distance between two places using google map. They calculate the amount of gas needed to get to a specific destination.
Curated OER
Migration of the Neo-Tropical Songbirds
Fifth graders plot the migration of birds using Google Earth. In this lesson on bird migration, 5th graders work in groups to plot the migration of a group of birds using Google Earth. Students present and discuss their findings and look...
PBL Pathways
College Costs 2
What is the financial benefit for attending a community college for the first two years before transferring to a four-year college? The second part of the educational lesson asks young scholars to explore this question through data...
Google
Write a Linear Equation Foldable
Simplicity and organization accompany the learning of linear equations in this handy foldable. Step by step, learners write a linear equation given two points, and then write a linear equation when given a graph. The point-slope...
Google
Properties of + and x Foldable
Clarify for young scholars the basic properties of addition and multiplication with this foldable math resource. Written on the front flaps are the terms commutative, associative, identity, and inverse...
Google
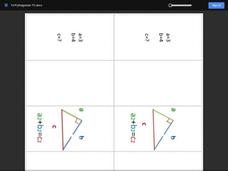
Pythagorean Theorem Foldable
Your geometry learners will enjoy this color-coded foldable that simply asks them to find the lengths of different legs and the hypotenuse of a right triangle using the Pythagorean Theorem.
Google
Solving Systems of Equations Foldable
Two of the strategies for solving systems of linear equations are represented in this foldable: substitution and elimination. Learners solve three examples of each.
Google
Quadratic Formula Foldable
Learners use the determinant of the quadratic formula to find the number of real number solutions that exist in each given quadratic function.
Google
Foldable Inequalities
Your learners will enjoy this simple summary of finding and graphing the solutions to variable inequalities.
Inspired By Kindergarten
Numbers 1-10
Preschoolers and kindergartners can master numbers 1-10 with a set of math worksheets. Each page features one number that kids trace, represent with tally marks, and write what number they will have after adding or subtracting 1.
Curated OER
Analyzing Discrete and Continuous Data in a Spreadsheet
You are what you eat! Your statisticians keep a log of what they eat from anywhere between a day to more than a week, keeping track of a variety of nutritional information using a spreadsheet. After analyzing their own data, individuals...
Google
Midpoint and Distance Foldable
Support young mathematicians with learning the concepts of midpoint and distance with this foldable resource. Offering both graphic examples and written equations, this reference clearly demonstrates for students how these...
Curated OER
Coordinate Plane Transformations
Geometric transformations are explored by high schoolers. They will create a set of instructions for plotting coordinates representing an original transformation of a real-world figure. These instructions are shared with middle...
Curated OER
The right number of...
For this numbers worksheet, students write the correct number of items that is asked such as tires on a truck, legs on a dog, and more. Students complete 22 pages and draw a picture of each.
Google
Surveys and Estimating Large Quantities
Looking for an estimation activity a bit more involved than the typical "guess the number of jellybeans in the jar" game? Here, learners use a picture to estimate the number of people at a large event, look for potential problems with...
Curated OER
Stochastic and Deterministic Modeling
Explore the difference between stochastic and deterministic modeling through programming. First have the class write algorithms for relatively simple tasks using pseudocode. Use the Python 2.7 program app to simulate Mendel's Pea Pod...
Google
The Law of Large Numbers and Probability
Learners investigate why theoretical probability doesn't always match reality. The activity involves using Python 2.7 (or Sage) to set up a Bernoulli Trial. It also involves setting up a spreadsheet to simulate the Birthday Paradox....


