Noyce Foundation
Pizza Crusts
Enough stuffed crust to go around. Pupils calculate the area and perimeter of a variety of pizza shapes, including rectangular and circular. Individuals design rectangular pizzas with a given area to maximize the amount of crust and do...
Houghton Mifflin Harcourt
Unit 8 Math Vocabulary Cards (Grade 5)
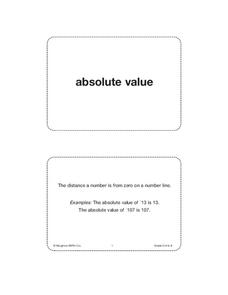
Reinforce math vocabulary with a set of flash cards. With a total of forty-eight cards, each are printed in bold font, and include definition cards that offer a labeled example. Terms include absolute value, ordered pair, variable and...
EngageNY
Nonlinear Models in a Data Context
How well does your garden grow? Model the growth of dahlias with nonlinear functions. In the lesson, scholars build on their understanding of mathematical models with nonlinear models. They look at dahlias growing in compost and...
West Contra Costa Unified School District
Average Rate of Change
The concept of slope gets an approachable, yet theoretical, treatment in a comprehensive algebra lesson. The use of functional notation and problem-solving techniques keep the material rigorous, but detailed teaching notes and lots of...
EngageNY
The Definition of a Parabola
Put together the pieces and model a parabola. Learners work through several examples to develop an understanding of a parabola graphically and algebraically.
CCSS Math Activities
Smarter Balanced Sample Items: High School Math – Claim 3
Communication is the key. A presentation provides 25 sample items for Claim 3, Communicating Reasoning, for the Smarter Balanced High School Math assessment. Items require pupils to answer the question and provide logical reasoning to...
PBL Pathways
Doctors and Nurses
How many nurses does it take to support one doctor? A project-based activity asks learners to analyze state data to answer this question. Classes create polynomial functions from the data of doctors and nurses over a seven-year period....
Curated OER
Math Mediator Lesson 10: Slope
Students explore the concept of slope. In this Algebra I lesson, students investigate the definition of slope as rise over run or change in y compared to change in x. The lesson includes a real-world problem in which the height of high...
Curated OER
Virtual Field Trip
Are we there yet? Young trip planners learn about their state and plan a trip. They will select sites to see in three cities in their state, and record associated costs in a spreadsheet. While this was originally designed as a...
Curated OER
Systems of Inequalities
In this Algebra I/Algebra II worksheet, students determine the solution to a system of inequalities by graphing. The two page worksheet contains explanation, instruction, and four worked problems.
Curated OER
ART PROJECT
Eighth graders, after researching the properties of graphs of conic sections, absolute value and inverse relations, make a drawing of precise functions and relations from a specified list of equations. The final design should analyze the...
Curated OER
Slope, slope-Intercept Form and Standard Form
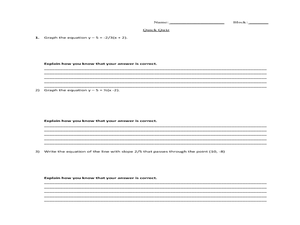
Students investigate and solve linear equations using slopes. In this algebra lesson, students graph lines using the slope and y intercept. They also find the slope by rewriting their equation in to slope-intercept form from standard form.
Curated OER
How Many Solutions 2
Students solve systems of equations. In this algebra lesson, students graph lines and identify the point of intersection. They identify the function to see if it is a function.
Curated OER
Slopes, Slope-Intercept Form, Standard Form
Students identify the slope of an equation using various methods. In this algebra lesson, students graph linear equations and calculate the slopes using the x and y intercept to solve the equations and graph the lines. They use the slope...
Curated OER
Slopes and Slope Intercepts
Young scholars identify the slope of an equation using various methods. In this algebra lesson, students graph linear equations and calculate the slopes using the x and y intercept to solve the equations and graph the lines. They use the...
Curated OER
Solving Systems of Inequalities
In this algebra worksheet, students solve systems of inequality using the graphing method. There are 5 questions with lots of examples and an answer key.
Curated OER
Math Journal: Functions and Coordinate Geometry
Fifth graders examine the many uses of coordinate grids. In this graphing lesson plan, 5th graders write data driven equations, discuss the x and y-axis, and determine if using 2 or 3 ordered pairs is better. Students complete several...
Curated OER
Mapping the Ocean Floor
Students construct and interpret a line graph of ocean floor depth and a bar graph comparing the height/depth of several well-known natural and man-made objects and places. In addition, they calculate the depth of two points using sonar...
Curated OER
Introduction of Single and Multiple Linear Inequalities
Students solve linear inequalities. In this algebra lesson, students rewrite inequalities using one and two step equations. They graph their findings and identify the slope and solution of the line.
Curated OER
Walking Home II
Students explore the relationship between distance and time. They analyze a situation involving distance traveled in a given period of time, represent the situation graphically and algebraically, and discuss the concept of slope as a...
Curated OER
Calculator-Based Lessons Help Examine Real-World Data
Students may determine equations based on graphs and regression models.
Curated OER
Parametric Races & Slopes
Learners investigate the slopes and parametric equations. In this calculus lesson plan, students solve parametric equations with specific parameters. They relate lines and slopes based on the derivative of the equation.
Curated OER
Two Investigations of Cubic Functions
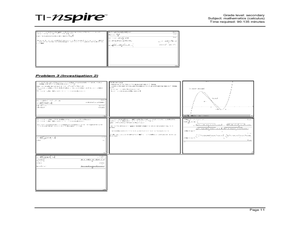
Through learning about cubic functions, students graph cubic functions on their calculator. Students determine the local maximum and minimum points and the tangent line from the x-intercept to a point on the cubic function. Students...
Curated OER
Be the Kiwi
Students analyze linear equation. In this algebra lesson plan, students analyze and graph data. They solve problems involving linear equations and graph lines using the slope and y intercept.


