Curated OER
Terrestrial Ecosystem Response to Climate Change
An extensive investigation of the Earth's climate changes awaits your environmental science classes. This top-notch presentation begins by looking at the history of Earth's climate and then predicts the impact on each major terrestrial...
Consortium for Ocean Science Exploration and Engagement (COSEE)
Climate Change Impacts on Blue King Crabs
Carbon dioxide is not only causing global temperatures to increase, it causes the oceans to become more acidic. Lesson focuses on the blue king crab and the fragility of the habitat due to climate change. Scholars create a concept map...
Curated OER
Environmental Agents of Mathematics: Mathematics for Change
High schoolers analyze environmental science data using Math. They do research about renewable energy, gather data, create graphs and interpret their findings. Then the group presents their arguments persuasively using their findings to...
Curated OER
Changing Planet: Withering Plants - Stressing Over Lost Water
Expectant earth scientists examine the bottom side of a leaf and learn the role of the stomata. They consider the gas exchange that occurs through these structures and relate how the climate is changing to its impact on food crops. This...
Curated OER
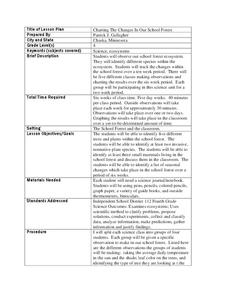
Charting the Changes in Our School Forest
Fourth graders investigate the ecosystem and how forests are disappearing. In this environmental protection lesson, 4th graders analyze the changes in their school for 2 weeks. Students practice identifying trees, birds, and foliage...
US Environmental Protection Agency
Carbon Through the Seasons
Meteorologists view an animated video by the Environmental Protection Agency to learn how the carbon cycle works, and then move into groups to analyze and graph actual data of the atmospheric carbon dioxide concentration from Hawaii's...
Chicago Botanic Garden
Historical Climate Cycles
What better way to make predictions about future weather and climate patterns than with actual climate data from the past? Young climatologists analyze data from 400,000 to 10,000 years ago to determine if climate has changed over time....
Rainforest Alliance
Forests of Guatemala
With 90 percent of its land area covered in forests, Suriname, a country in South America, contains the largest percentage of forests throughout the world. Here is an activity that brings classmates together to learn about the...
US Environmental Protection Agency
Getting to the Core: The Link Between Temperature and Carbon Dioxide
Polar ice samples provide scientists with valuable information about the condition of the atmosphere for hundreds of thousands of years in the past. Of particular interest is the amount of carbon dioxide in the atmosphere and its...
Curated OER
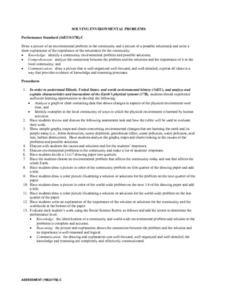
Solving Environmental Problems
Students identify a community environmental problem and possible solutions. They analyze the connection between the problem and the solutions and the importance of it to the local community. Students then draw a picture of an...
National Academy of Sciences
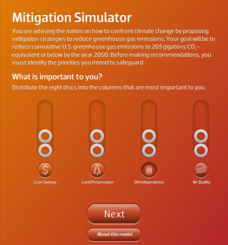
Mitigation Simulator
The United States has more per capita emissions than any other country in the world. An eye-opening simulation encourages users to explore environmental goals and factors that affect climate change by balancing different priorities....
Rainforest Alliance
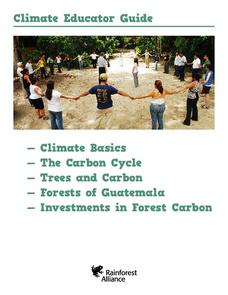
Climate Educator Guide
Climate change is a hot topic in the news. Class members examine carbon dioxide data to analyze trends of our atmospheric makeup over time. They also discuss climate and climate change, and determine how these changes are affecting life...
Curated OER
Petro Products
In this petroleum products activity, students are given the components of crude oil and they graph the various products found in a 50 gallon barrel. Students complete an activity to determine if they have collected cards that represent...
National Park Service
What Can We Do?
Motivate young conservationists to stand up and make a change. After learning about the efforts in Cascade Nation Park to reduce carbon emissions in order to preserve the wilderness, students work in groups creating action plans for...
Curated OER
Science Jeopardy
Wow! Review an entire semester of biology curriculum playing this Science Jeopardy game! The variety of topics is extremely broad, so you will need to review each question to find if they all apply to your course. As you find material...
Curated OER
Analyzing Tree Rings to Determine Climate Change
Students examine how to locate and access data sets. In this climate change lesson plan students import data into Excel and graph it.
Curated OER
Illuminating Climate Change: Connecting Lighting and Global Warming
Students analyze energy usage and connect energy usage to fossil fuel consumption. In this global warming and pollution activity, students what fuels are used to generate electricity and how much CO2 each fuel produces, then graph the...
Cheetah Outreach
Population Change
Your youngsters become cheetahs in search of food, water, shelter, and space in a fun physical game that does a fantastic job of representing fluctuating species population based on resources available over years.
Centers for Disease Control and Prevention
Microbe Multiplication Magic
A lesson introduces the reproduction rate of E. coli though a video. Then scholars complete a data table and graph of reproduction rates in ideal conditions as well as less than ideal conditions.
Michigan State University
Bug Lyphe!
Introduce ecology classes to biodiversity and interdependence in ecosystems with a PowerPoint presentation. Then, they get up-close and personal with the invertebrate world by collecting insects, classifying them, and graphing their...
Curated OER
The Hudson's Ups and Downs
Even rivers have tides. Older elementary schoolers will discuss the Hudson River and how weather, water craft, and the ocean cause tidal fluctuation. They will examine a series of line graphs that depict tidal fluctuation, then analyze...
Curated OER
Science: Lead Shot and Waterfowl
Students examine data to investigate the impact of lead shot pellets on waterfowl populations. They graph their findings and discover how lead in ingested by birds and poisons them. As an extension, students research legislation and...
Curated OER
Mathemafish Population
It's shark week! In this problem, young mathematically minded marine biologists need to study the fish population by analyzing data over time. The emphasis is on understanding the average rate of change of the population and drawing...
Virginia Department of Education
Hurricanes: An Environmental Concern
Hurricanes, typhoons, and tropical cyclones are the same type of storm, but their names change based on where they happen. Scholars use a computer simulation to learn about hurricanes. Then they hypothesize ideas to prevent hurricanes...


