Statistics Education Web
How Wet is the Earth?
Water, water, everywhere? Each pupil first uses an Internet program to select 50 random points on Earth to determine the proportion of its surface covered with water. The class then combines data to determine a more accurate estimate.
Sunburst Visual Media
Clouds
Support science instruction with a combination of engaging activities and skills-based worksheets that focus on clouds. Learners take part in grand discussions, write an acrostic poem, complete graphic organizers, solve word...
Safe Routes to School
Pollution & Evolution
Bring together a study of two major scientific topics with a lesson on the relationship between pollution and evolution. With the help of a PowerPoint presentation, hands-on activity. and class demonstration young scientists learn...
PBS
NASA's Eyes on the 2017 Eclipse
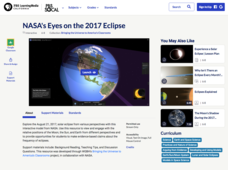
How did the 2017 eclipse look in Los Angeles—or Chicago? Experience both views, plus many more, using a lesson from PBS's Space series for middle schoolers. Scholars follow the movements of the sun, moon, and Earth during the most recent...
K-State Research and Extensions
Water
How are maps like fish? They both have scales. The chapter includes six different activities at three different levels. Scholars complete activities using natural resources, learn how to read a map, see how to make a compass rosette,...
Curated OER
What On Earth
Students explore earth science through concept mapping, discussion, and self-discovery.
Curated OER
Floating Plates on the Earth
Fourth graders construct a concept map about Plate Tectonics. They include types of movement, names and effects of boundaries. They research plate tectonics, describe and name 3 types. They analyze the effect on the earth's surface of...
Curated OER
Seasons on Earth
Young scholars examine how seasons occur and explore how the different angles effect surface heating. In this climate lesson students interpret satellite maps of the world that show seasonal differences in plant life.
Curated OER
Changing Planet: Sea Levels Rising
Begin by showing a six-minute video, Changing Planet: Rising Sea Level as an anticipatory set. Pupils draw a topographic map of a potato continent. Finally, they will visit NOAA's sea levels online map and NASA's carbon dioxide...
Teach Engineering
Searching for Bigfoot and Others Like Him
Individuals create a GIS data layer in Google Earth that displays information about where one might find seven different cryptids. The class members research to find data on cryptid sightings they can include in their data...
US Environmental Protection Agency
Mapping Greenhouse Gas Emissions Where You Live
After investigating the US Environmental Protection Agency's climate change website, your environmental studies students discuss greenhouse gas emissions. They use an online interactive tool to look at data from power production...
Curated OER
How Does Your Garden Grow? Discovering How Weather Patterns Affect Natural Cycles
For the warm-up in this cool climate lesson, you will need to click on "Mapping" and then "US Mapping" once you arrive at NOAA's "US Climate at a Glance" page. Earth science explorers realize that 2012 was a warm winter for us. They read...
Curated OER
Build a Model Watershed
Collaborative earth science groups create a working model of a watershed. Once it has been developed, you come along and introduce a change in land use, impacting the quality of water throughout their watershed. Model making is an...
Carnegie Mellon University
Renewables Workshop
Youngsters examine resource maps to find out which states are using solar and wind power and discuss as a class various other renewable energy sources. They use a provided data table to record pros and cons to each technology, build and...
Port Jefferson School District
Hurricane Katrina
Young scientists track Hurricane Katrina across the Atlantic Ocean as they learn about these destructive forces of nature. Provided with a table of data tracking the location and conditions of Katrina over a one week span, students...
Curated OER
Identifying Watersheds with Topographic Maps
Students model a watershed and delineate one using topographic maps. In this hydrology lesson, students use aluminum foil to model a landscape and observe how water moves on it. They also observe the features of a topographic map and use...
Alabama Learning Exchange
The Sun and the Earth
Third graders study and diagram the positions of the Earth and sun during the four seasons. They predict weather for cities in the northern and southern hemispheres.
Centers for Ocean Sciences
Ocean and Great Lakes Literacy: Principle 1
Is your current lesson plan for salt and freshwater literacy leaving you high and dry? If so, dive into part one of a seven-part series that explores the physical features of Earth's salt and freshwater sources. Junior hydrologists...
National Wildlife Federation
I Speak for the Polar Bears!
Climate change and weather extremes impact every species, but this lesson focuses on how these changes effect polar bears. After learning about the animal, scholars create maps of snow-ice coverage and examine the yearly variability and...
Astronomical Society of the Pacific
Getting Ready for the All American Eclipse!
Give your pupils a front row seat at the biggest light show in the sky this year! In addition to admiring the total solar eclipse, young astronomers can explain the phenomenon with a little help from an inquiry-based instructional...
Curated OER
Making and Mapping a Volcano
Students build a baking soda volcano model. In this earth science lesson, students identify the sequence of lava flows. They make a volcano map using their models.
Curated OER
Research Report on Earth Science Topics
Sixth graders are given a variety of Earth Science topics which be covered during the year. They select one of their choices to research and work in class and at home to meet the guidelines for their report.
Curated OER
Gallery Walk Questions on Earth's Radiation Balance
Questions that can be used in a lesson on Earth's radiation balance are suggested in this resource. It is not a lesson plan, per se, but it is a list of questions for stations within a "Gallery Walk" lesson. The link to how Gallery Walks...
Curated OER
Isoseismal Maps
Young scholars examine the difference between magnitude and intensity in earthquakes. They complete map work and write a first hand account of a person living in each level of intensity on the Modified Mercalli Scale.
