Hi, what do you want to do?
Discovery Education
Mood Music!
Grouchy? Sad? Here's a great resource that shows kids how music can be used to lift their spirits. Kids collect and chart data on the effects of music on emotions. After analyzing the results of their experiment, they develop...
Alabama Learning Exchange
Ice Cream Sundae Survey
Young scholars analyze data through graphs. They will complete a class survey on ice cream sundaes and tally and graph the responses. They then analyze the information from the class graph.
Curated OER
Math: Graphs and Their Symbols
Second graders examine different types of graphs and discover the meanings of the symbols used on them. After gathering data about themselves, their communities, and the world, they use that information to create graphs. Among the...
Alabama Learning Exchange
What's Your Favorite Chocolate Bar?
Students complete a math survey. In this math graphs lesson plan, students complete a survey about their favorite candy bars. Students create different kinds of graphs using Microsoft Excel to show their results.
Curated OER
Range and Mode
Students interpret data from graphs. In this range and mode lesson, students review a tally chart, pictograph and bar graph. Students use these graphs to calculate the range and mode of each set of data.
Alabama Learning Exchange
Poppin' For Popcorn!
Students graph data from different popcorn flavors. In this graphing lesson, students make graphs using an assigned web site after collecting data about the flavors of popcorn that fellow classmates prefer.
Curated OER
Translucent, Transparent and Opaque Objects
Students examine different objects. In this appearance lesson, students watch a video about translucent, transparent and opaque objects. Students work in pairs to examine a bag of objects and then discuss the results.
Curated OER
Tulip Graphing
Students create a graph of tulip growth. In this data analysis lesson, students plant tulip bulbs and use graph paper to begin graphing data on the growth of the tulip.
Curated OER
Living in the Desert
Conduct an investigation on the plants used by the Hohokam tribe. To survive in the harsh desert environment the Hohokam used many natural resources. Learners read, research, map, and graph multiple aspects of Hohokam plant use as a...
Alabama Learning Exchange
Inch by Inch
Third graders listen to a read-aloud of Leo Lionni's, Inch by Inch before measuring a variety of items using both standard and metric units. They record the measurement data and follow a recipe for dirt pie.
Alabama Learning Exchange
Can Plants Be Grown in Space?
Students investigate finding a solution to growing plants in space. They define key vocabulary terms, conduct an experiment growing plants, explore various websites, and participate in a live video conference with NASA regarding the...
Alabama Learning Exchange
Meteor or Meteorite
Students differentiate between a meteor and meteorite. They participate in an experiment to discover how the size and weight of an object determines the size of the impact crater. They utilize their math skills by measuring with a ruler...
Illustrative Mathematics
Illustrative Mathematics: 3.oa, Md, Nbt Classroom Supplies
The purpose of this task is for students to solve problems involving the four operations and draw a scaled picture graph and a scaled bar graph to represent a data set with several categories. Aligns with 3.NBT.A.2;...
Education Place
Houghton Mifflin: Eduplace: Make a Living Bar Graph
Student use simple data to line up in a living bar graph activity when they respond to simple questions in this lesson plan. They physically and visually represent the data. CCSS.Math.Content.3.MD.B.3 Draw a scaled picture graph and a...
Khan Academy
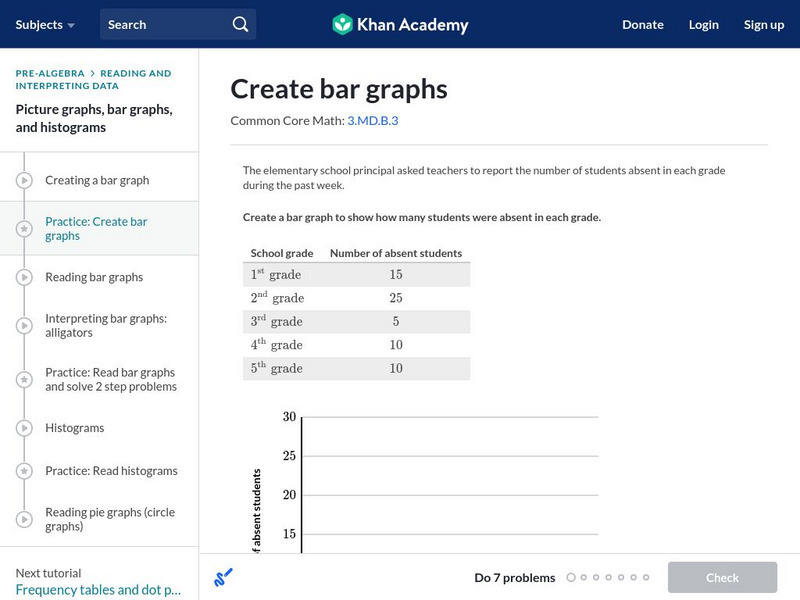
Khan Academy: Create Bar Graphs
Create a bar graph with the data given. Students receive immediate feedback and have the opportunity to try questions repeatedly, watch a video tutorial, or receive hints about creating bar graphs. CCSS.Math.Content.3.MD.B.3 Draw a...
Khan Academy
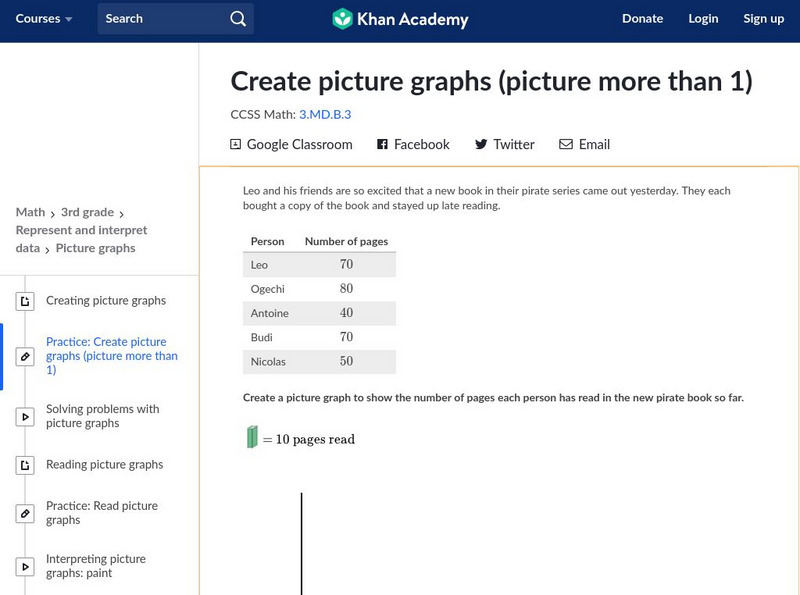
Khan Academy: Create Picture Graphs (Picture More Than 1)
Create and interpret picture graphs. Students receive immediate feedback and have the opportunity to try questions repeatedly, watch a video tutorial, or receive hints about how to create picture graphs. CCSS.Math.Content.3.MD.B.3 Draw a...
Khan Academy
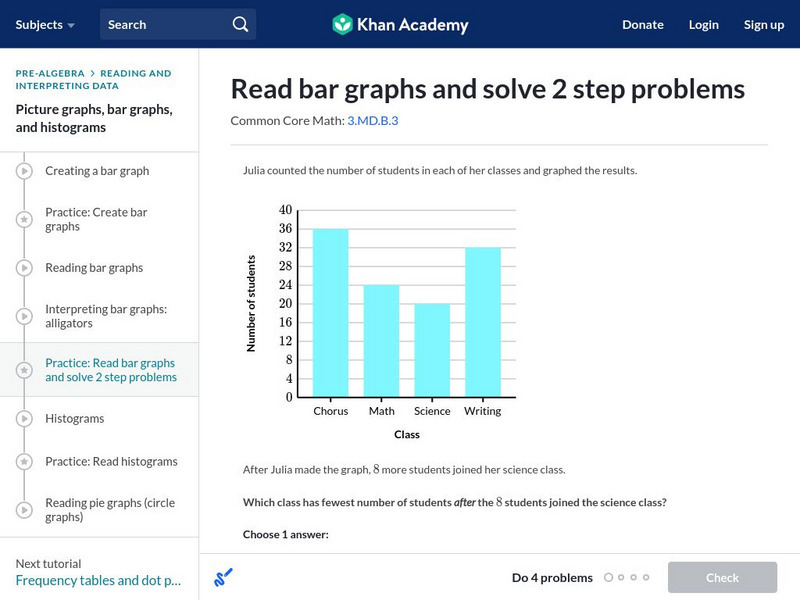
Khan Academy: Read Bar Graphs and Solve 2 Step Problems
Read and interpret a double bar graphs. Students receive immediate feedback and have the opportunity to try questions repeatedly, watch a video or receive hints. CCSS.Math.Content.3.MD.B.3 Draw a scaled picture graph and a scaled bar...
Khan Academy
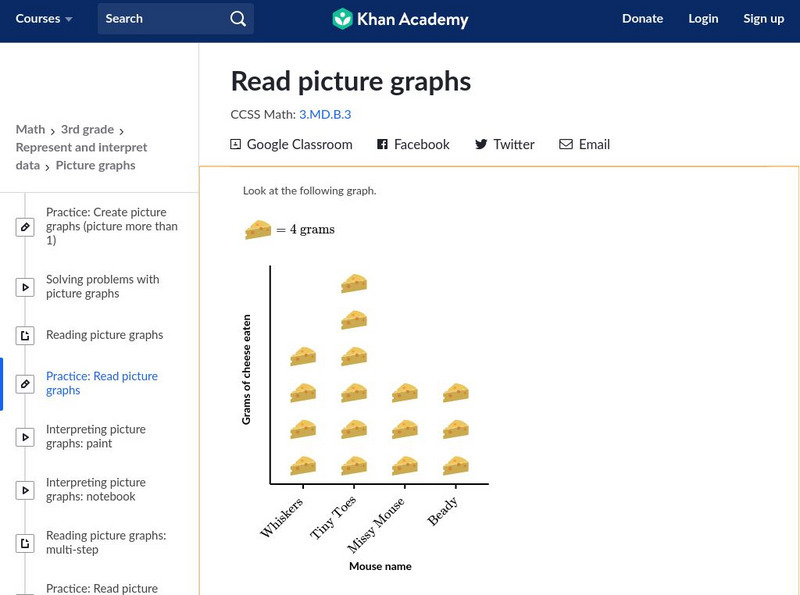
Khan Academy: Read Picture Graphs
Use picture graphs to solve word problems. Students receive immediate feedback and have the opportunity to try questions repeatedly, watch a video or receive hints. CCSS.Math.Content.3.MD.B.3 Draw a scaled picture graph and a scaled bar...


