Curated OER
Musical Note Value
Students will identify each symbol by sight stating the value of each. They will use cardboard notes to who what they have learned so far about the note values creating 4 and 6 count phrases.
Curated OER
Adding Note Values
Students use the values of musical notes to complete math problems. They study the names and values of musical notes, define the word beat as it relates to music. They complete math problems using music note values.
Curated OER
Lesson Exchange: Musical Mathematics (other, Music)
Students explain note values and relationships, especially dotted rhythms and tied notes by giving them a visual, hands on representation
EngageNY
Expected Value of a Discrete Random Variable
Discover how to calculate the expected value of a random variable. In the seventh installment of a 21-part module, young mathematicians develop the formula for expected value. They connect this concept the dot product of vectors.
Curated OER
Music Notes
Students identify music notes. For this music notes lesson, students toss bean bags between partners the number of times of a note (quarter, half, dotted half, etc) value. Students also practice underhand tosses.
Curated OER
Note Bowling
Students practice recognition of different music notes and their values and work on throwing cues, scoring, and addition.
EngageNY
Understanding Box Plots
Scholars apply the concepts of box plots and dot plots to summarize and describe data distributions. They use the data displays to compare sets of data and determine numerical summaries.
Curated OER
Music Box Identification
Fourth graders draw and label music notes and rests. In this music box lesson students use staff paper to draw the notes required. The students give the value of each note or rest.
EngageNY
Sampling Variability and the Effect of Sample Size
The 19th installment in a 25-part series builds upon the sampling from the previous unit and takes a larger sample. Pupils compare the dot plots of sample means using two different sample sizes to find which one has the better variability.
Curated OER
Rhythm In Motion
Sixth graders work independently and with a partner to demonstrate proficiency of steady beat, meter and basic note values while creating written rhythmic patterns for class performance. State and National Standards are addressed.
EngageNY
Connecting Graphical Representations and Numerical Summaries
Which graph belongs to which summary statistics? Class members build upon their knowledge of data displays and numerical summaries to connect the two. Pupils make connections between different graphical displays of the same data in...
Hawaiʻi State Department of Education
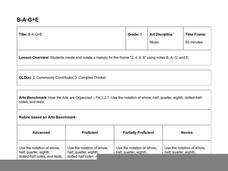
B-A-G+E
Budding musicians discuss rhythmic notation and melody as they play a bar instrument or recorder. They use the notes B, A, G, and E to play a simple melody, and then they use those same four notes to turn a poem into a song. They...
EngageNY
Describing the Center of a Distribution Using the Median
Find the point that splits the data. The lesson presents to scholars the definition of the median through a teacher-led discussion. The pupils use data lists and dot plots to determine the median in sets with even and odd number of data...
EngageNY
The Mean as a Balance Point
It's a balancing act! Pupils balance pennies on a ruler to create a physical representation of a dot plot. The scholars then find the distances of the data points from the balance point, the mean.
Arts & Humanities
Pizza Arts Storage Box
Where do you put all of those fantastic art projects you've done throughout the year? In a pizza box! Yes, learners will use pizza boxes to create strong vibrant portfolios for all their art work. Note: Clean pizza boxes can be donated...
EngageNY
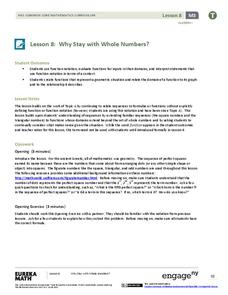
Why Stay with Whole Numbers?
Domain can be a tricky topic, especially when you relate it to context, but here is a lesson that provides concrete examples of discrete situations and those that are continuous. It also addresses where the input values should begin and...
Curated OER
Shoot the Whole Notes
Students practice underhand throwing skills, identify values of musical notes, and add values of notes (adding fractions). students should be familiar with the names of notes and their values in 4/4 time.
Curated OER
Decimal Addition and Subtraction
In this decimal addition and subtraction worksheet, students use a computer program for initial instruction, then complete 22 problems with decimals.
EngageNY
Summarizing a Distribution Using a Box Plot
Place the data in a box. Pupils experiment with placing dividers within a data set and discover a need for a systematic method to group the data. The 14th lesson in a series of 22 outlines the procedure for making a box plot based...
EngageNY
Describing Variability Using the Interquartile Range (IQR)
The 13th activity in a unit of 22 introduces the concept of the interquartile range (IQR). Class members learn to determine the interquartile range, interpret within the context of the data, and finish by finding the IQR using an...
EngageNY
Describing the Center of a Distribution
So the mean is not always the best center? By working through this exploratory activity, the class comes to realize that depending upon the shape of a distribution, different centers should be chosen. Learners continue to explore...
EngageNY
Describing Center, Variability, and Shape of a Data Distribution from a Graphical Representation
What is the typical length of a yellow perch? Pupils analyze a histogram of lengths for a sample of yellow perch from the Great Lakes. They determine which measures of center and variability are best to use based upon the shape of the...
EngageNY
The Mean Absolute Deviation (MAD)
Is there a way to measure variability? The ninth resource in a series of 22 introduces mean absolute deviation, a measure of variability. Pupils learn how to determine the measure based upon its name, then they use the mean...
Curated OER
Creating Sight-Singing Originals
Students create sight-singing examples for presentation in the high school choir class. Day One is used for review/introduction of the material. Day Two is used for student work time and Day Three is for presentation and evaluation.


