Curated OER
Box and Whisker Plots
Seventh graders explore the concept of box and whisker plots. In this box and whisker plots lesson, 7th graders plot data on a box and whisker plot. Students discuss the mean, median, and mode of the data. Students discuss range,...
Curated OER
Graphing Parabolas and Circles
Students graph parabolas and circles. In this algebra lesson, students create a table of values and graph the coordinate pairs to create a graph. They graph a circle using the radius and center.
Curated OER
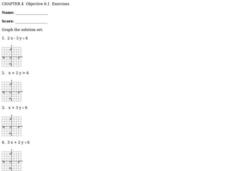
Graphing Inequalities
In this graphing inequalities learning exercise, students solve and graph the solution set for eight inequalities. They first solve each inequality, either for x or for y, then they plot the coordinates found on the graph provided for...
Curated OER
Basic Algebra and Graphing for Electric Circuits
In this electronics worksheet, students evaluate mathematical expressions to complete 16 short answer and problem solving questions.
Curated OER
In A Heartbeat
Students discuss scatter plots then create a class scatter plot using their heart rate at rest and their heart rate after a few minutes of aerobic exercises. Students copy the points plotted as a class and create individual graphs...
Curated OER
Give Me A Break!
Students create and conduct a survey. In this broken bones lesson, students discuss if they've ever broken a bone and how a broken bone heals. Students generate questions for a survey on broken bones and healing time, conduct the survey...
Math Sphere
Co-Ordinates
Challenge young mathematicians' understanding of the coordinate plane with this series of skills practice worksheets. Offering 10 different exercises that involve identifying ordered pairs,...
Curated OER
Coordinate Plotting: Shapes
In this math worksheet, students graph ordered pairs on a coordinate grid. They connect the points to create a geometric shape. This worksheet generator allows teachers to select the size of the grid, the complexity of the shapes, and if...
Curated OER
US Airports, Assessment Variation
Determining relationships is all part of algebra and functions. Your mathematicians will decide the type of relationship between airports and population and translate what the slope and y-intercept represent. The problem is multiple...
Houghton Mifflin Harcourt
Unit 8 Math Vocabulary Cards (Grade 4)
Enhance fourth graders' math vocabulary with 17 word cards and their definitions. Learners focus on terms that deal with graphing, such as y-axis, coordinates, plot, and ordered pair in the last set of math vocabulary cards.
Georgia Department of Education
The Basketball Star
Have learners use math to prove they are sports stars! Assess a pupil's ability to create and analyze data using a variety of graphs. The class will be motivated by the association of math and basketball data.
Curated OER
Histograms and Statistical Graphics
In this statistics worksheet, students solve 6 data problems. They construct a histogram of given data, they create a frequency polygon, and a stem and leaf diagram. Students create a dot plot and a pie chart for given data sets. On the...
National Council of Teachers of Mathematics
Eruptions: Old Faithful Geyser
How long do we have to wait? Given several days of times between eruptions of Old Faithful, learners create a graphical representation for two days. Groups combine their data to determine an appropriate wait time between eruptions.
Curated OER
Plotting the Ocean Floor
Fourth graders plot points on a graph, connect the dots to make the ocean floor profile and label the topographical features. They utilize a worksheet and a website imbedded in this plan to plot the ocean floor.
Radford University
Let's Buy a Car
Ready to buy a car? Learners research different makes and models of cars to decide on the best one to buy. They collect data on cost, fuel efficiency, safety ratings, and insurance costs, then create and analyze data displays to make...
Curated OER
Organizing Data
In this statistics worksheet, 11th graders collect data and organize it using a frequency table. They plot their data and analyze it using stem and leaf plots. There are 3 questions with an answer key.
Curated OER
Coordinates
In this coordinates worksheet, students analyze two maps and identify the coordinates of ten specific locations. Students plot sixteen points on a graph and check their answers online at the end of each exercise.
Curated OER
Scatterplots and Regressions
For this scatterplots and regressions worksheet, students solve 6 different types of problems related to graphing scatterplots and interpreting regressions. First, they create a scatterplot from the given data coordinates and then,...
Statistics Education Web
The United States of Obesity
Mississippi has both the highest obesity and poverty rate in the US. Does the rest of the data show a correlation between the poverty and obesity rate in a state? Learners tackle this question as they practice their skills of regression....
EduGAINs
Data Management
Using a carousel activity, class members gain an understanding of the idea of inferences by using pictures then connecting them to mathematics. Groups discuss their individual problems prior to sharing them with the entire class....
Statistics Education Web
Sampling in Archaeology
Compare different random sampling types using an archaeological setting. Scholars collect data from an archaeological plot using simple random samples, stratified random samples, systematic random samples, and cluster random samples....
Curated OER
Making Connections
Eighth graders investigate the input/output model for building function tables. From the data, 8th graders connect tables, graphs, function rules, and equations in one variable. They work backwards to determine function rules for given...
Curated OER
Scientific Observation of Force and Acceleration on an Object
In this force and acceleration learning exercise, 8th graders answer ten questions based on two graphs. The first graph is a scatter plot, the second is a line graph.
Curated OER
Measures of Central Tendencies: Quartiles
In this statistics worksheet, students calculate the mean, median, mode, range, lower quartile, and upper quartile for 10 questions and interpret a box and whiskers graph.


