EngageNY
Describing Distributions Using the Mean and MAD
What city has the most consistent temperatures? Pupils use the mean and mean absolute deviation to describe various data sets including the average temperature in several cities. The 10th instructional activity in the 22-part series asks...
EngageNY
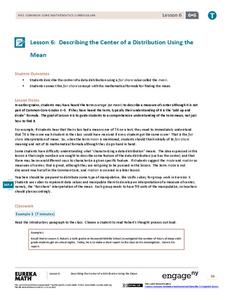
Describing the Center of a Distribution Using the Mean
Everyone does their fair share. The sixth segment in a 22-part unit presents the mean as a fair share. Groups build a conceptual understanding of the mean of a data set, rather than simply learn an algorithm. Learners use the...
EngageNY
The Mean as a Balance Point
It's a balancing act! Pupils balance pennies on a ruler to create a physical representation of a dot plot. The scholars then find the distances of the data points from the balance point, the mean.
Mathematics Assessment Project
Mean, Median, Mode, and Range
What a find! Here is a instructional activity, designed to meet sixth grade math Common Core standards, that focuses on the calculation of different measures of center for the scores from a penalty shoot-out competition. An independent...
EngageNY
Using Sample Data to Compare the Means of Two or More Populations
Determine whether there is a difference between two grades. Teams generate random samples of two grade levels of individuals. Groups use the mean absolute deviation to determine whether there is a meaningful difference between the...
EngageNY
Describing Distributions Using the Mean and MAD II
The 11th lesson in the series of 22 is similar to the preceding lesson, but requires scholars to compare distributions using the mean and mean absolute deviation. Pupils use the information to make a determination on which data set is...
EngageNY
The Mean Absolute Deviation (MAD)
Is there a way to measure variability? The ninth resource in a series of 22 introduces mean absolute deviation, a measure of variability. Pupils learn how to determine the measure based upon its name, then they use the mean absolute...
EngageNY
Sampling Variability
Work it out — find the average time clients spend at a gym. Pupils use a table of random digits to collect a sample of times fitness buffs are working out. The scholars use their random sample to calculate an estimate of the mean of the...
EngageNY
Variability in a Data Distribution
Scholars investigate the spread of associated data sets by comparing the data sets to determine which has a greater variability. Individuals then interpret the mean as the typical value based upon the variability.
EngageNY
Using Sample Data to Compare the Means of Two or More Populations II
The 23rd segment in a series of 25 presents random samples from two populations to determine whether there is a difference. Groups determine whether they believe there is a difference between the two populations and later use an...
Curated OER
Worksheet 15-Fall 1995
In this math worksheet students use the intermediate value theorem to solve two problems. They find parallel lines that will cut a convex shape into two pieces with equal areas. Students repeat this problem with a concave shape. Students...
Curated OER
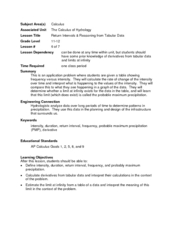
Return Intervals & Reasoning from Tabular Data
Students calculate derivatives from a set of data. In this calculus lesson, students estimate the limit at infinity. They complete a Return Interval handout at the end of the lesson.
EngageNY
Sampling Variability and the Effect of Sample Size
The 19th installment in a 25-part series builds upon the sampling from the previous unit and takes a larger sample. Pupils compare the dot plots of sample means using two different sample sizes to find which one has the better variability.
EngageNY
Presenting a Summary of a Statistical Project
Based upon the statistics, this is what it means. The last lesson in a series of 22 has pupils present the findings from their statistical projects. The scholars discuss the four-step process used to complete the project of their...
Curated OER
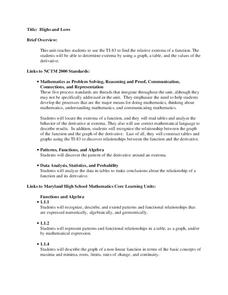
Highs and Lows
Solve problems using integration and derivatives. By using calculus, learners will analyze graphs to find the extrema and change in behavior. They then will identify the end behavior using the derivatives. Activities and handouts are...
Curated OER
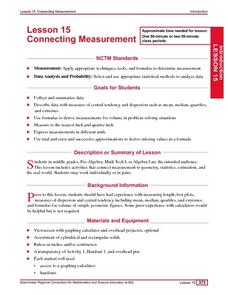
Connecting Measurement
Students participate in activities the connect measurement to geometry, statistics, estimation, and the real world. They collect measurements from their elbow to the tip of their middle finger and make a box plot of the data as well as...
EngageNY
Describing Center, Variability, and Shape of a Data Distribution from a Graphical Representation
What is the typical length of a yellow perch? Pupils analyze a histogram of lengths for a sample of yellow perch from the Great Lakes. They determine which measures of center and variability are best to use based upon the shape of the...
EngageNY
Summarizing a Data Distribution by Describing Center, Variability, and Shape
Put those numbers to work by completing a statistical study! Pupils finish the last two steps in a statistical study by summarizing data with displays and numerical summaries. Individuals use the summaries to answer the statistical...
Curated OER
River Optimization Problem
Students define the different methods used for optimizing a particular element of a problem. In this optimization problem lesson, students optimize appropriate details of a problem using data collection, algebra, technology, and/or...
EngageNY
Why Worry About Sampling Variability?
Are the means the same or not? Groups create samples from a bag of numbers and calculate the sample means. Using the sample means as an estimate for the population mean, scholars try to determine whether the difference is real or not.
EngageNY
Percent and Rates per 100
What percentage of your class understands percents? Pupils learn the meaning of percents based upon rates per 100 in the 24th lesson in a series of 29. They represent percents as fractions, decimals, ratios, and models. The scholars...
EngageNY
Simplifying Square Roots
Explore the process of simplifying square roots through an analysis of perfect squares. The fourth lesson of 25 expects individuals to find the perfect square factors in each radicand as a means of simplifying. The perfect square factor...
EngageNY
Exponential Notation
Exponentially increase your pupils' understanding of exponents with an activity that asks them to explore the meaning of exponential notation. Scholars learn how to use exponential notation and understand its necessity. They use negative...
EngageNY
Read Expressions in Which Letters Stand for Numbers II
Reading and writing take on a whole different meaning in math class. Young mathematicians learn to read verbal phrases by focusing on operation words. They write equivalent algebraic expressions for both mathematical and contextual...


