EngageNY
Mixture Problems
What percent of the mixture is juice? Pairs use their knowledge of proportions to determine what percent a mixture is juice given the percent of juice in the components. Pupils use the procedure learned with the juice mixture problem to...
EngageNY
Part of a Whole as a Percent
Pupils use visual models, numeric methods, and equations to solve percent problems. To complete the second installment of 20, they find the part given the percent and the whole, find the percent given the part and the whole, and find the...
EngageNY
Finding One Hundred Percent Given Another Percent
Class members solve problems to find the whole when given a percent. They use double line numbers and factors of hundred to help break the 100 percent into equal segments.
EngageNY
Estimating Probabilities by Collecting Data
Take a spin to determine experimental probability. Small groups spin a spinner and keep track of the sums of the spins and calculate the resulting probabilities. Pupils use simulated frequencies to practice finding other probabilities to...
EngageNY
Chance Experiments with Equally Likely Outcomes
Take a deeper dive into equally likely probabilities. Pupils build upon their understanding of probability by determining sample spaces and outcomes. Individuals work with sample spaces and determine outcomes that are equally likely....
EngageNY
Calculating Probabilities for Chance Experiments with Equally Likely Outcomes
Calculate theoretical probabilities and compare them to experimental probabilities. Pupils build on their knowledge of experimental probabilities to determine theoretical probabilities. Participants work several problems with the...
EngageNY
Chance Experiments with Outcomes That Are Not Equally Likely
The fifth portion of the 25-part series introduces probabilities calculated from outcomes that are not equally likely. Class members use tables to calculate probabilities of events, add outcome's probabilities, and find complements....
EngageNY
Using Tree Diagrams to Represent a Sample Space and to Calculate Probabilities
Cultivate the tree of knowledge using diagrams with two stages. Pupils create small tree diagrams to determine the sample space in compound probability problems. The lesson uses only two decision points to introduce tree diagrams.
EngageNY
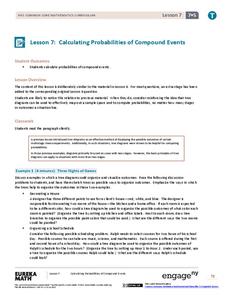
Calculating Probabilities of Compound Events
Use tree diagrams with multiple branches to calculate the probabilities of compound events. Pupils use tree diagrams to find the sample space for probability problems and use them to determine the probability of compound events in the...
EngageNY
The Difference Between Theoretical Probabilities and Estimated Probabilities
Flip a coin to determine whether the probability of heads is one-half. Pupils use simulated data to find the experimental probability of flipping a coin. Participants compare the long run relative frequency with the known theoretical...
EngageNY
Comparing Estimated Probabilities to Probabilities Predicted by a Model
Small groups devise a plan to find the bag that contains the larger percentage of blue chips. they then institute their plans and compare results to the actual quantities in the bags.
EngageNY
Using Sample Data to Compare the Means of Two or More Populations II
The 23rd segment in a series of 25 presents random samples from two populations to determine whether there is a difference. Groups determine whether they believe there is a difference between the two populations and later use an...
EngageNY
Why Worry About Sampling Variability?
Are the means the same or not? Groups create samples from a bag of numbers and calculate the sample means. Using the sample means as an estimate for the population mean, scholars try to determine whether the difference is real or not.
EngageNY
Percent
Extend percent understandings to include percents less than one and greater than 100. A great lesson has pupils build upon their knowledge of percents from sixth grade. They convert between fractions, decimals, and percents that are less...
EngageNY
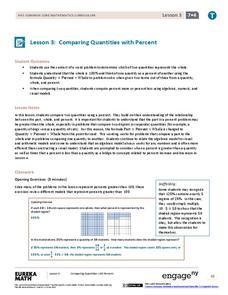
Comparing Quantities with Percent
Be 100 percent confident who has the most and by how much. Pupils use percentages to help make the comparisons by finding what percent one quantity is of the other. They also determine the percent differences between the two quantities.
EngageNY
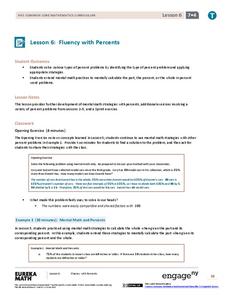
Fluency with Percents
Pupils build confidence working with percents as they work several types of percent problems to increase their fluency. The resource contains two sets of problems specifically designed to build efficiency in finding solutions of basic...
EngageNY
Percent Error Problems
Individuals measure a computer monitor and determine how accurate their measures are. The eighth segment in a series of 20 introduces the concept of percent error. Pupils find the percent error of their measurements and discuss the...
EngageNY
Tax, Commissions, Fees, and Other Real-World Percent Problems
Pupils work several real-world problems that use percents in the 11th portion of a 20-part series. The problems contain percents involved with taxes, commissions, discounts, tips, fees, and interest. Scholars use the equations formed for...
EngageNY
Conducting a Simulation to Estimate the Probability of an Event II
Add some randomization into simulations. The 11th installment in a series of 25 presents two new methods to use in simulations--colored disks, and random numbers. Pupils use random numbers to run simulations where the probabilities make...
EngageNY
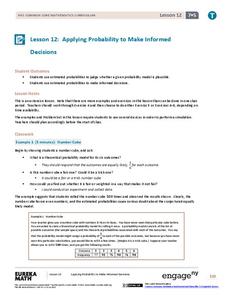
Applying Probability to Make Informed Decisions
Use simulations to determine the probabilities of events to make decisions. Class members are presented with several scenarios, some with known probabilities and others without. Groups run simulations to gather data that they then use to...
EngageNY
Selecting a Sample
So what exactly is a random sample? The 15th part in a series of 25 introduces the class to the idea of selecting samples. The teacher leads a discussion about the idea of convenient samples and random samples. Pupils use a random...
EngageNY
Populations, Samples, and Generalizing from a Sample to a Population
Determine the difference between a sample statistic and a population characteristic. Pupils learn about populations and samples in the 14th portion in a unit of 25. Individuals calculate information directly from populations called...
EngageNY
Random Sampling
Sample pennies to gain an understanding of their ages. The 16th installment of a 25-part series requires groups to collect samples from a jar of pennies. Pupils compare the distribution of their samples with the distribution of the...
EngageNY
Sampling Variability and the Effect of Sample Size
The 19th installment in a 25-part series builds upon the sampling from the previous unit and takes a larger sample. Pupils compare the dot plots of sample means using two different sample sizes to find which one has the better variability.
Other popular searches
- Calculus Derivatives
- Derivative Nouns
- Calculus, Derivatives
- Base Word Derivatives
- Complex Derivative
- Derivatives of Logarithms
- Second Derivative
- Derivative Quotient Rule
- Word Derivatives
- Derivative Function
- Directional Derivatives
- Latin Derivatives


