EngageNY
Analyzing a Data Set
Through discussions and journaling, classmates determine methods to associate types of functions with data presented in a table. Small groups then work with examples and exercises to refine their methods and find functions that work to...
Curated OER
Use a Table
In this elapsed time activity, students analyze a schedule of events at a picnic with the starting times listed. Students read and solve 6 problems in which the elapsed time is calculated.
Education Development Center
Creating a Polynomial Function to Fit a Table
Discover relationships between linear and nonlinear functions. Initially, a set of data seems linear, but upon further exploration, pupils realize the data can model an infinite number of functions. Scholars use multiple representations...
EngageNY
Variability in a Data Distribution
Scholars investigate the spread of associated data sets by comparing the data sets to determine which has a greater variability. Individuals then interpret the mean as the typical value based upon the variability.
EngageNY
Using Sample Data to Estimate a Population Characteristic
How many of the pupils at your school think selling soda would be a good idea? Show learners how to develop a study to answer questions like these! The activity explores the meaning of a population versus a sample and how to interpret...
California Education Partners
Colorful Data
Scale up your lessons with a performance task. Young data analysts work through an assessment task on scaled bar graphs. They answer questions about a given scaled bar graph on favorite colors, analyze a bar graph to see if it matches...
Curated OER
Eat Your Veggies
Students investigate displaying data. In this displaying data lesson, students use tallies to count data about food preferences. Students use various types of graphs such as bar graphs, picture graphs, box-and-whisker plots, etc to...
Curated OER
Data
Students collect data from an experiment they perform. In this data lesson plan, students use multiple representations to solve practical problems; describe advantages and disadvantages of the use of each representation. Then, they...
Curated OER
Dot Plots
Number crunching statisticians explore displaying data with dot plots and define the difference between quantitative data and qualitative data. Dot plots are created based on a set of given data and analyzed.
Curated OER
How to Draw a Bar Chart Correctly
Your class has gathered their data, so what's the next step? They need to display and analyze their data, and a bar chart is a perfect tool for the job. This resource provides the step-by-step instructions those kids need to construct a...
Curated OER
What's in a Graph?
How many yellow Skittles® come in a fun-size package? Use candy color data to construct a bar graph and a pie chart. Pupils analyze bar graphs of real-life data on the Texas and Massachusetts populations. As an assessment at the end of...
EngageNY
Distributions and Their Shapes
What can we find out about the data from the way it is shaped? Looking at displays that are familiar from previous grades, the class forms meaningful conjectures based upon the context of the data. The introductory lesson to descriptive...
Curated OER
Multi-dimensional Modeling of Ore Bodies Making Sense of Empirical Data
Math scholars identify four different rock types in that strata and use this identification and data to construct a two dimensional geologic cross-section. They use data tables to construct a three-dimensional geologic cross-section.
Utah Education Network (UEN)
Linear Relationships: Tables, Equations, and Graphs
Pupils explore the concept of linear relationships. They discuss real-world examples of independent and dependent relationships. In addition, they use tables, graphs, and equations to represent linear relationships. They also use ordered...
Curated OER
Data Analysis: For Little Learners
Using pictographs, tally charts, and surveys, kids learn all about data analysis and collection. They make surveys, collect data, then construct pictographs and tally charts to organize their information.
Curated OER
Representing Data
Second and third graders answer questions based on data presented to them in graphs. They see how to interpret data from a bar graph, line graph, and a chart.
Curated OER
Graphs and Data
Students investigate poverty using graphs. In this algebra lesson, students collect data on the effects of poverty and use different rules to analyze the data. They graph and use the trapezoid rule to interpret the data.
Curated OER
Creating Tables and Bar Charts
A great way to introduce the concepts of data collection, bar charts, and data analysis. Learners see how their teacher used the data from fifty of her friends to construct a bar chart showing their favorite toys.
Curated OER
Graphs to Represent a Data Set
How many animals did Chaplin see at the zoo? Scholars examine three data sets and create a bar graph for each. Encourage them to label the different parts of their graphs, as this is not prompted on the worksheet. Once they finish their...
Curated OER
Graphs to Represent a Data Set
By analyzing a word problem about hours worked in a week, scholars get valuable practice with bar graphs and data analysis. They read the scenario, then examine a table of data taken from it. The data includes four days and the...
Curated OER
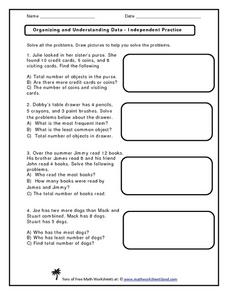
Organizing and Understanding Data - Independent Practice
Provide your first graders with an opportunity for independent practice organizing and understanding data. The ten story prompts on this three-page worksheet asks learners to solve problems involving concepts of the total number of...
Curated OER
Generate Measurement Data Word Problems
Beginning graphers will appreciate this practice with basic bar graphs. For each table of data, there is a corresponding graph for learners to match it to. The five data sets all have the same two factors: days and numbers. Although this...
Curated OER
Graphs that Represent Data Sets
Use these pre-made data sets to introduce kids to bar graphs and data analysis, and then have them take surveys on their own. There are 10 survey scenarios written out here, and scholars synthesize the results of each into a bar graph....
Curated OER
Collect and Organize Data - Practice 14.1
In this data collection worksheet, students read the word problem and study the tally chart about favorite sports. Students then use the information in the chart to answer the questions. Students then use the list about students'...
Other popular searches
- Creating Data Tables
- Science Data Tables
- Making Data Tables
- Organizing Data in Tables
- Data Tables and Graphing
- Graphs and Data Tables
- Data Tables and Charts
- Create Data Tables From Graphs
- Data Tables Lesson Plans
- Data Tables Surveys
- Pocket Data Tables
- Using Data Displays


