Howard Hughes Medical Institute
Spreadsheet Tutorial 4: t-Test
The t-test tutorial will fit your needs to a T. After calculating the mean, sum of squares, standard deviation, and variance of two data sets on a spreadsheet, scholars learn to calculate the t-values. They then learn to use the TTEST...
Curated OER
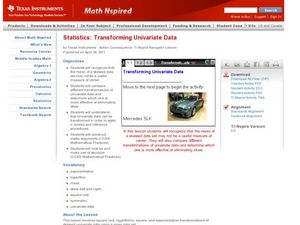
Transforming Univariate Data
Learners analyze plotted data in this statistics lesson. They differentiate between skewed and normal data. They also explore and interconnect exponential growth and decay as it relates to the data.
Curated OER
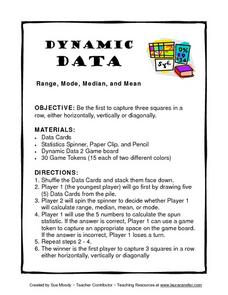
Dynamic Data Range, Mode, Median, and Mean
In this lesson plan, Dynamic Data Range, Mode, Median, and Mean, students play a game while figuring range, mode, median, and mean. Students spin for their task, figure the mode, mean, median or range of a row of numbers and gain a space...
Curated OER
Who Has the Data? Monitoring Coral Reefs
High schoolers access data to characterize coral reefs. For this scientific research lesson, students access data and explain the need for such data when monitoring coral reefs. They will identify and explain three major threats to coral...
Curated OER
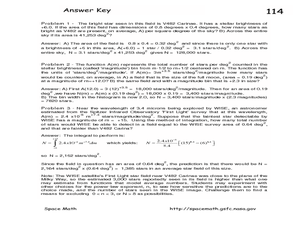
Exploring Power-Law Functions Using WISE Data!
In this power-law functions worksheet, students solve 3 problems using data from the Wide-field Infrared Survey Experiment in the constellation Carina. Students use a photograph to determine the number of stars as bright as the brightest...
Curated OER
Small and Large Squares
Young mathematicians classify squares according to attributes. They sort squares according to specific attributes. Students explore squares in repeating patterns and order squares according to size. Engaging extension activities are...
Curated OER
The Football and Braking Distance: Model Data with Quadratic Functions
High schoolers engage in a lesson that is about the concept of data analysis with the use of quadratics. They use a Precalculus text in order to give guidance for independent practice and to serve as a source for the teacher to use. The...
Curated OER
Statistical Analysis For Graphing Calculators
Students analyze date from the Chesapeake Bay. Using a graphing calculator, they enter the data, plot three temperatures, and create a Box and Whisker plot.
Curated OER
Squares in the Light
Students collect and analyze data using a graph. In this algebra lesson, students explain their findings orally and with a graph. They use their knowledge to solve real life scenarios.
Mathematics Assessment Project
Generalizing Patterns: The Difference of Two Squares
After completing an assessment task where they express numbers as the difference of squares (i.e., 9 = 5^2 – 4^2), class members note any patterns that they see in the problems.
Statistics Education Web
NFL Quarterback Salaries
Use statistics to decide if NFL quarterbacks earn their salaries! Learners study correlation coefficients after using technology to calculate regression equations. Through the data, they learn the meaning of correlation and correlation...
Radford University
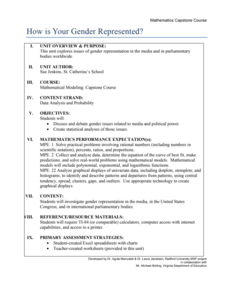
How Is Your Gender Represented?
Does the media shape people's views on gender? Scholars use data on gender portrayal in magazines to explore the idea. They use a spreadsheet program to create bar graphs and perform a chi-square test. They also use provided data to...
Curated OER
Square Roots Worksheet
For this square roots worksheet, students calculate the value of a number squared. They determine the square root of a number. Students find the area of objects. This five-page worksheet contains 10 problems. Answers are provided.
Curated OER
Price of Apples- Linear Data
Pupils collect data and create a graph. In this algebra lesson plan, students describe functions graphically, algebraically and verbally. They identify functions as being independent and dependent using variables.
Curated OER
Sorting Data
In this sorting shapes worksheet, students categorize 10 shapes as squares or shapes in a venn diagram organizer by writing the shapes corresponding number in the correct position on the graphic organizer.
Curated OER
Appalachia
Middle schoolers investigate the benefits of dance and participate in dances. In this dance lesson plan, students investigate a number of dances such as square dancing and clogging that are native to Appalachia. They use math concepts to...
Cornell University
Celebrate Urban Birds
Set up a 50x50 square foot area in a space at school and choose three days to go outside and observe the birds seen in a 10 minute span. The activity has learners tapping into their observation skills and creates awareness of the birds...
Biology Junction
Mendelian Genetics
Over the course of seven years, Gregor Mendel grew more than 28,000 pea plants. The large amount of data he collected led him to postulate the rules of genetics as we understand them today. Scholars learn about Mendel, genetics, and...
Curated OER
Least Squares Fit Line
Practice makes perfect! Learners estimate the least squares fit line for a set of data. They understand error involved in least squares fit lines, and solve application problems using least square fit lines.
Curated OER
Which Chocolate Is The Biggest?
Students investigate the concepts of area and perimeter with the use of chocolate bars. They calculate the perimeter and area of different size rectangle chocolate bars and record the statistics. Then students make a visual comparison...
Curated OER
Maps and Lines
In these organizing data worksheets, 5th graders complete four worksheets of activities that help them learn maps, graphs, and lines. Students then study images of maps, lines, and graphs.
Curated OER
Developing an Understanding for Square Roots
In this algebra worksheet, students discover properties of squares while making squares with a Geoboard. There are two charts to complete and 15 questions.
Curated OER
More on Least Squares
In this least squares worksheet, students solve 3 different problems that include determining the least squares of equations. First, they use the data given in the table to write out the normal equations a system of 2 equations in 2...
Curated OER
Dare to be Punnett Square
Eighth graders become familiar with Punnett squares, specifically purpose, application and interpretation. Key terms from previous lessons (included below) are reviewed/reinforced before data is applied to a Punnett square and interpreted.


