Council for Economic Education
GDP Data: Is the Economy Healthy?
Does the economy needs a check-up? Scholars analyze the gross domestic product (GDP) to determine the overall health of the current economy. They use a short video clip as well as economic data to determine the current growth of the...
Curated OER
Using Data to Determine the Location of the Stiffest Opposition to School Desegregation in the 1970's
Students analyze historical data. In this school desegregation lesson, students make predictions about opposition to desegregation, examine the provided desegregation data, and determine if their predictions were correct.
US Department of Commerce
Community Change
America is a country on the move. Analyzing data from the Census Bureau, class members gauge the people moving in and out of their areas. An interactive web feature allows pupils to see who is moving out and moving in, while discussion...
Curated OER
Did Voters Turn Out -- or Are They Turned Off?
What was the voter turnout at your last state election? Examine voter turnout statistics from the most recent election to learn which ten states have the best turnout record. This lesson offers election data, handouts, and worksheets.
Federal Reserve Bank
Invest in Yourself
What are the different ways that people can invest in their human capital for a better future? Pupils participate in an engaging hands-on activity and analyze data regarding unemployment, the ability to obtain an education, and median...
Curated OER
Obstacles to Success: Misleading Data
Eleventh graders explore how data reported by country agencies can mislead the public intentionally or unintentionally. In this Cross Curricular activity, 11th graders analyze charts and graphs in order to draw conclusions. Students...
Curated OER
The Gathering and Analysis of Data
Young mathematicians gather data on a topic, graph it in various forms, interpret the information, and write a summary of the data. They present their data and graphs to the class.
School Improvement in Maryland
Pollution Data
Smog? Vog? What is being done about air pollution? Government classes investigate federal and state programs designed to improve air quality, and then develop a proposal for further actions that are needed.
Curated OER
Lesson 1: Map Data and the Census
Young scholars learn about the history of the census. In this U. S. Census lesson plan, students develop an understanding about how the United States Constitution grants and distributes power and discover how the spatial organization of...
Curated OER
Coal Supply and Demand
A hands-on simulation perfect for an economics lesson plan, young learners investigate the availability of different sources of natural energy (coal, natural gas, oil, solar, and nuclear) and how this availability affects their...
American Psychological Association
A Tasty Sample(r): Teaching about Sampling Using M&M’s
Here's a sweet activity! As part of a study of psychological research methods and statistic gathering, individuals develop a hypothesis about the number of each color of M&Ms in a fun-size package. They then count the number of each...
Curated OER
Projections and the Census
Students learn why the census makes a difference. In this U.S. Census lesson plan, students connect data and history in their study of previous population booms and analyze census data in order to make predictions about the future.
Curated OER
Create Your Own Form
Students gather and organize data using a mock census form, and determine mean, mode, range, and median for sets of data.
Curated OER
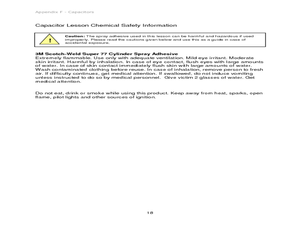
Capacitors: What Are They?
Students discover how capacitors help store data. In this computer science lesson, students investigate how capacitors can store an electronic charge, eventually helping computers store data. Students create their own...
Curated OER
2010 Census Lesson 1: It's About Us
Young scholars analyze data from the 2000 census to learn how the census works. In this civics lesson, students read a story to find out about the census, then use a map and census data to analyze changes. Lesson includes related...
Curated OER
These Maps are for the Birds
Students identify and study New York State Breeding Bird Atlas maps to learn where different bird species nest and how their distributions have changed over time. They also identify how maps serve as representations of a geographic...
Curated OER
Where Should We Put a Store?
Students analyze population data. They convert population data into simple density maps to help make decisions about their world. They select the best location for a school store based on population density. They present their maps...
Curated OER
Canada at a Glance
Stjudents examine the statistics in a Canadian publication for use in graphs. They develop their own questions based on tables and graphs found in this publication..
Curated OER
The People of Kansas: Where did they come from and why did they come?
Students review census data to correlate to emigration in Kansas. For this Westward Expansion lesson, students analyze a painting and create definitions for emigration and discuss why people emigrate. Students read and analyze 1855...
Curated OER
Dear George Using Census Data
Sixth graders discuss differences in the way in which information was disseminated in George Washington's time and how it is acquired in contemporary times. They examine Census of Agriculture data and a modern day version of a letter...
PBS
The New West: Interactive Map | A Biography of America
Using this interactive map activity, from A Biography of America, explore how the "New West" evolved during the late 20th century, transforming from the wild, untamed Old Rocky Mountain West into a smaller, more accessible "New West."...
Curated OER
Distribution of children living at home
Students use E-STAT to examine demographics. In this social demographics instructional activity, students use statistical data to determine if a particular family is in need of assistance. Students will discuss social and educational...
Curated OER
Effects of Temperature, Deviation on Climate
Students collect and record data for a given city. They calculate standard deviation of temperature and analyze the impact of climate changes on a city's and culture.
Curated OER
Comparing Countries
Students compare facts about different countries. In this comparing lesson, students collect information about the US and another country and compare them. Students locate countries on the map and make a hypothesis about the lives of...


