Perkins School for the Blind
Volume, Mass, and Density Boxes
Mass and density are difficult topics for kids to understand, and even more difficult when you have visual impairments or blindness. Learners will make boxes and fill them with cotton, sand, or crushed paper. They will feel the density...
NASA
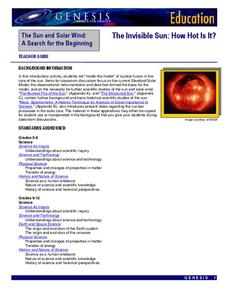
The Invisible Sun: How Hot Is It?
It's getting hot in here! The first in a series of six lessons has learners model nuclear fusion with a simple lab investigation. Groups collect data and analyze results, comparing their models to the actual process along the way.
Curated OER
Egg Hunt
Middle schoolers make detailed qualitative and quantitative observations. They are introduced to the process of developing repeatable procedures. Students practice collecting data. They review measurement skills. Middle schoolers...
Howard Hughes Medical Institute
Survival of the Fittest - Variations in the Clam Species Clamys sweetus
It's not often that you come across a clever laboratory activity that is both imaginative and comprehensive! Using M&M's and Reese's peanut butter candies to represent two different clam species, young biologists test for "relative...
Intel
Forensics: Get a Clue
Although the methods are all scientific, forensic science was started by police officers rather than scientists, who relied on observation and common sense. Young detectives use many tools to solve crimes around the school in a...
University of Georgia
Using Freezing-Point Depression to Find Molecular Weight
Explore the mathematical relationship between a solvent and solute. Learners use technology to measure the cooling patterns of a solvent with varying concentrations of solute. Through an analysis of the data, pupils realize that the rate...
NASA
Discovering the Milky Way
What do you call a tiny collection of galaxies? A puny-verse! Young scholars graph data gathered by scientists studying Cepheids. They attempt to identify a relationship between the variables through standard and logarithmical graphing....
Chicago Botanic Garden
Weather or Not
What is the difference between weather and climate? This is the focus question of a lesson that takes a deeper look at how weather data helps determine climate in a region. Using weather and climate cards, students decide if a statement...
Curated OER
Analytical Problem Solving
Students explore about propagation of error in calculations using experimental data. They develop their weighing and pipetting techniques. Students explore the following terms: Standard deviation and relative standard deviatin. They...
Curated OER
Strange New Planet
Fourth graders gather data and simulate a Mars spacecraft mission using multi-sensory observations.
Curated OER
Earthquake Epicenter
Students use chart data to determine the location of the epicenter of an earthquake. This task assesses students' abilities to generalize and infer, organize data, interpret data, and apply mathematical concepts.
PBS
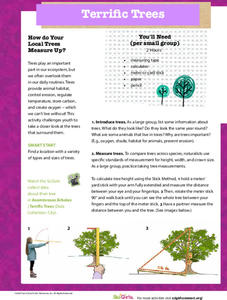
Terrific Trees
Engage in a shady activity to practice measurement techniques. Classes venture outside to collect measurements of various trees, using different strategies to measure the height, trunk circumference, width, and crown size. Then they...
Curated OER
Bouncing Light
Students design an experiment to investigate how light reflects. In this physics lesson, students apply the scientific method in conducting the experiment. They collect data and formulate a conclusion.
NASA
MASS, MASS – Who Has the MASS? Analyzing Tiny Samples
What is it worth to you? A hands-on lesson plan asks groups to collect weights of different combinations of coins and calculate weighted averages. They use the analysis to understand the concept of an isotope to finish the third lesson...
Curated OER
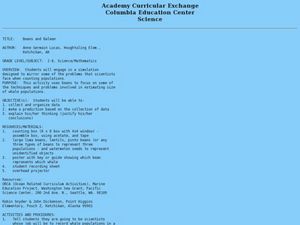
Beans and Baleen
Predict whale populations using different beans as whales! Learners observe different types of beans in a dish knowing that each bean represents a different kind of whale. They then predict how many "whales" there are in a certain area....
Curated OER
Sports Helmets and Impact Testing of Polymers
Students examine the importance of good quality safety gear. In this investigative lesson, students will tests various polymers, collect data, and analyze the data to determine which polymer is best for safety helmets. They will design a...
Curated OER
Scientific Method- "The Big Ahah"
Students experiment with water, dropper and a coin to study the scientific method. In this scientific method lesson plan, students are in groups, each with a coin, water and a dropper. They investigate how many drops of water can fit on...
Curated OER
A Neighborhood Expedition
Students plan and conduct an expedition through their neighborhood based on the techniques used by the Harriman Expedition to Alaska in 1899. They research the Harriman expedition on the internet and then create a route and collection...
Curated OER
Fluke: Whale Watching Activity
Sixth graders observe and record data about humpback whales in Hawaii. In this humpback whale watching lesson, 6th graders watch the activity of whales from a Hawaiian beach. They record data about their behavior and complete a research...
Curated OER
Probing Under the Surface
Eighth graders use a measuring stick to determine the shape of the inside of the bottom of a box, then apply their knowledge to an additional situation. This task assesses students' abilities to make simple observations, collect and...
Curated OER
Permafrost
Students use a thermometer to analyze soil temperature data to determine which soil sample is normal, and which one is permafrost. In this permafrost lesson plan, students participate in a hands on activity where they identify the active...
Curated OER
Prairie Restoration and Prairie Ecology
Students collect data as they identify and classify native prairie plants and insects. They create their own population study using a variety of sampling techniques to determine the population density of various species. Students...
Curated OER
Measuring Rainfall and Relationships Between pH, Alkalinity and Suspended Solids in the Pago River
Eleventh graders test the pH and alkalinity of Pago River. In this ecology lesson, 11th graders collect data and use spreadsheet to graph results. They analyze and share their findings with the class.
Curated OER
Insect Monitoring
Students practice the scientific method in the classroom, either in preparation or as a substitution for real-world field experience. They examine a simulated biodiversity research situation, using a "mini-plot" or
sampling square...


