EngageNY
Calculating Conditional Probabilities and Evaluating Independence Using Two-Way Tables (part 1)
Being a statistician means never having to say you're certain! Learners develop two-way frequency tables and calculate conditional and independent probabilities. They understand probability as a method of making a prediction.
Curated OER
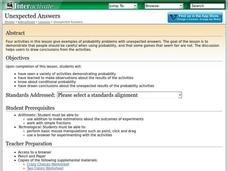
Unexpected Answers
High schoolers explore the concept of fairness. In this fairness lesson, students play four probability games. High schoolers determine who has the best chance of winning each of the four games. Students discuss which games gave an...
Curated OER
Figure This! Math Challenges for Families
Young mathematicians complete a family math challenge packet. They will complete a packet of mixed math activities. They work with graphs, comparing numerical data, tessellations, and probability.
Beyond Benign
Can You Hear Me Now? Cell Phone Accounts
How sustainable are cell phones? Throughout the unit, learners explore the issues around cell phones concerning sustainability. Class members take a graphical look at the number of cell phones across the world using a box-and-whisker...
CK-12 Foundation
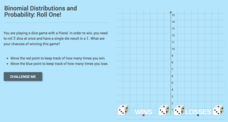
Binomial Distributions and Probability: Roll One!
It takes exactly one to win. Pupils calculate the probability of rolling five dice and having only a single die come up with a one. Learners calculate the number of expected wins out of a series of games. The interactive provides...
National Wildlife Federation
When It Rains It Pours More Drought and More Heavy Rainfall
Which is worse — drought or flooding? Neither is helpful to the environment, and both are increasing due to climate change. The 16th lesson in a series of 21 covers the average precipitation trends for two different climates within the...
Curated OER
Data Analysis and Probability Race to the Finish
Students practice addition facts, record data, and construct a bar graph. In this probability lesson, students participate in a board game in which bicycles move towards a finish line based on players completing addition problems. Dice...
Curated OER
Weather, Data, Graphs and Maps
Students collect data on the weather, graph and analyze it. In this algebra lesson, students interpret maps and are able to better plan their days based on the weather reading. They make predictions based on the type of clouds they see.
Bowland
How Risky is Life?
"Life is more risk management, rather than exclusion of risks." -Walter Wriston. Scholars use provided mortality data to determine how likely it is a person will die from a particular cause. They compare the data to the perception of the...
Curated OER
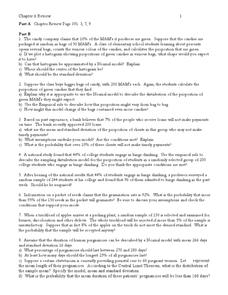
Random Probability
In this statistics and probability worksheet, young statisticians solve and complete 13 different problems related to probability, percentages, and normal distributions. They consider data models, assumptions about the models, and find...
Curated OER
ABC Data Sheet Version 2
I have filled out quite a few of these in my day! This ABC (antecedent, behavior, consequence) sheet is intended to collect comprehensible data to help determine the function of a particular behavior. This is a vital tool for assessing...
Curated OER
Probability
Second graders experiment with probability. In this probability lesson, 2nd graders pick colored beans from a bag to find the chance of getting different colors. They make fair and unfair spinners and record the data after spinning them.
Curated OER
Probability
Third graders conduct experiment, collect data, predict, record, and discuss outcomes, and analyze data for probability.
Curated OER
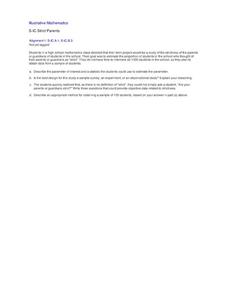
Strict Parents
Are your parents or guardians strict? That's an interesting question many of your pupils are probably interested in discussing. How do you design a study directed at your high schooler to gain insight into that question? How do you...
Curated OER
Using Excel to Reference and Graph Live Data from a Web Site
Students collect live buoy data about water temperatures in the Gulf of Mexico from the Internet and work individually to organize their data and create a line graph using Excel Spreadsheet. Students analyze their data and examine any...
Curated OER
Probability
Here is a classic activity used to introduce your class to the concept of probability and data collection. They will roll one die 30 times, then record and discuss the results. Great introduction, but too shallow to be considered a...
EngageNY
Estimating Probability Distributions Empirically 1
What if you don't have theoretical probabilities with which to create probability distributions? The 11th installment of a 21-part module has scholars collecting data through a survey. The results of the survey provide empirical data to...
American Statistical Association
Chocolicious
To understand how biased data is misleading, learners analyze survey data and graphical representations. They use that information to design their own plans to collect information on consumer thoughts about Chocolicious cereal.
Curated OER
Data Collection and Presentation
Young scholars access how to collect, classify and display data involving statistics. The concepts of quantitative, discrete and continuous data is covered in depth within the lesson. They practice with a scenario of James filled with...
Curated OER
Data collection and analysis
In this probability and statistics worksheet, high schoolers determine when a survey or collected data could be biased. The one page worksheet contains a combination of three multiple choice and free response questions. Answers are...
Curated OER
Seeing Is Believing
Students investigate the concepts of probability. They use data to find the central tendency, median, and mode. Students design and play a game in order to practice the concepts. They also complete a table with data that is analyzed.
Curated OER
Data Collection
Students investigate qualitative and quantitative data. In this statistics lesson, students gather data on heights and weights of people and graph the distribution. Students discuss the differences between qualitative and quantitative data.
Virginia Department of Education
May I Have Fries with That?
Not all pie graphs are about pies. The class conducts a survey on favorite fast food categories in a lesson on data representation. Pupils use the results to create a circle graph.
Inside Mathematics
Population
Population density, it is not all that it is plotted to be. Pupils analyze a scatter plot of population versus area for some of the states in the US. The class members respond to eight questions about the graph, specific points and...
Other popular searches
- Probability and Data Analysis
- Probability and Data
- Collect Probability Data
- Probability Data and Graphs
- Probability Data
- Probability and Data Usage
- Probability Data Analysis


