WindWise Education
Which Blades Are Best?
If I change the length, will they work better? After brainstorming the variables of wind turbine blade design, groups choose one variable to isolate and test. The groups then present their data to the class in order for all to have the...
EngageNY
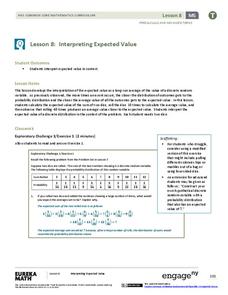
Interpreting Expected Value
Investigate expected value as a long-run average. The eighth installment of a 21-part module has scholars rolling pairs of dice to determine the average sum. They find aggregate data by working in groups and interpret expected value as...
Beyond Benign
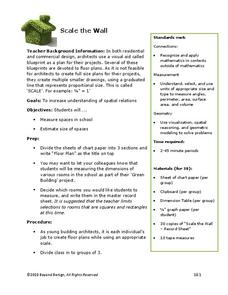
Scale the Wall
How can you fit an entire school on one sheet of paper? You use scale! Scholars measure rooms in the school and, using the correct scale, design a floor plan that includes area calculations with their data.
Curated OER
Technology - Data Collection
Students collect and analyze data from the United States Census Bureau. Using spreadsheet technology, students explore their results and make preductions about income groups. Students compute the mean, median and mode. They create...
Curated OER
Ketchup to Collecting Data
First graders collect data for a survey of 3 brands of ketchup and create class charts. They taste test three different brands of ketchup, and use the data to create a presentation. Tasty instructional activity!
Curated OER
And You Thought Gasoline Was Expensive!
Students carry out a cost analysis. In this comparative math lesson, students compare the cost of equal measures of gasoline to mouthwash, house paint, fruit juice, white-out, and other liquids.
Curated OER
Agricultural Statistician
High schoolers explore how statistics effect their daily lives. They discuss how statistical data is collected for the purposes of agriculture.
Curated OER
Grade 1: More Land or Water?
First graders listen as the teacher reads a story involving cross-continent traveling. Students collect a random sample by tossing an inflatable globe and recording whether they touch land or water each time they catch the globe in order...
Curated OER
Creating a Graph
Students brainstorm favorite things to do during the summer. They survey classmates to collect data, arrange it in a chart, and create graphs using ClarisWorks.
Curated OER
Light Stick Chemistry
In this descriptive investigation worksheet, 6th graders conduct an investigation to determine if heat energy affects the brightness of a light stick. The students will form a prediction, collect data and answer 3 conclusion questions.
Curated OER
Observations (collecting data)
Students observe and collect data about the earthworm. In this observation of an earthworm lesson plan, students use an earthworm to determine the effects of light and incline on the earthworm's behavior. They practice making...
Curated OER
Beans and Birds: A Natural Selection Simulation
Students solve the following problem concerning the evolution of seed color in pinto bean plants: "How does natural selection change the frequency of genes or traits over many generations?" They use the constructivist approach to...
Curated OER
Measuring Lung Capacity
Sixth graders explore measuring lung capacity. In this respiratory system lesson, 6th graders conduct an experiment on their fellow class mates that measures how much air capacity their lungs have. Students record and graph the data...
Curated OER
The Life Cycle of the Mealworm
Fourth graders provide a habitat for live mealworms and observe their life cycle. In this animal life cycle and scientific inquiry lesson, 4th graders create a habitat for a live mealworm and observe and record related data as it grows....
Curated OER
Osmosis and the Cell Membrane-part 2
Students participate in a review of diffusion and the basic properties of the cell membrane before exploring the process of osmosis in a lab activity. Using shell-less eggs that have soaked in various solutions, students make...
Curated OER
Biospheres in Your Backyard
Students collect data from a local river biome. They use the information for metric conversion and graphing equations. They study the components of what makes up a biosphere and how math is used to analyze one.
Curated OER
Compare Sets of Objects Guided Lesson
Practice math vocabulary terms fewer, more, and data using this visual-object-analysis guide. Learners observe three sets of objects and answer three questions, two of which compare numbers of objects, and the last which asks scholars to...
Curated OER
Pet Shop Decision
Learners are given the "Pet Store Decisions" task sheet and a rubric that goes with it. Students discuss the task and make a plan for using the rubric sheet to complete the task. Learners formulate questions, studies and data collection...
Curated OER
Observing the Evidence
Fifth graders explore how to do research from a large group. They explore how to choose a representative sample and collect data from it.
Curated OER
Effects of Temperature, Deviation on Climate
Students collect and record data for a given city. They calculate standard deviation of temperature and analyze the impact of climate changes on a city's and culture.
Curated OER
Graphing Family Reading Habits
Second graders collect data from their families about their reading habits and graph them. In this graphing family reading habits lesson, 2nd graders interview family members about their reading habits. They then use a graphing computer...
Curated OER
Risk Assessment and Geometry
Tenth graders study the concept of risk analysis as it relates to geometry. In this spatial relationship instructional activity, 10th graders are provided a set of coordinates to analyze a piece of land described. Students write a...
Curated OER
Graphing
Fifth graders practice using math graphs. In this graphing lesson, 5th graders work in groups to develop a topic of their own to represent as a graph. Students collect data and construct a graph for the lesson.
Curated OER
Plastic Packaging
Young scholars collect data. In this math lesson, students collect data about recyclable materials. Young scholars develop a plan that will help the environment. Recycling plastic containers is discussed.
Other popular searches
- Data Collection and Analysis
- Collection of Data
- Leaf Collection Data
- Random Data Collections
- Collection of Data Jobs


