Curated OER
Lesson 2: Ultimate Classroom - Web Model
Students create a scale drawing. In this ultimate classroom lesson, groups of students create a scale drawing of the ultimate classroom. They explore the and explain the constructed design.
Curated OER
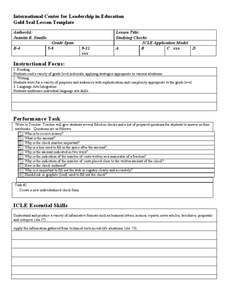
Studying Checks
While on-line banking and electronic payments seem to be the way of the future, next-generation wage earners still need to understand the details of check writing. Here the focus is on the details of the check including what the...
EngageNY
Every Line is a Graph of a Linear Equation
Challenge the class to determine the equation of a line. The 21st part in a 33-part series begins with a proof that every line is a graph of a linear equation. Pupils use that information to find the slope-intercept form of the...
EngageNY
Structure in Graphs of Polynomial Functions
Don't allow those polynomial functions to misbehave! Understand the end behavior of a polynomial function based on the degree and leading coefficient. Learners examine the patterns of even and odd degree polynomials and apply them to...
EngageNY
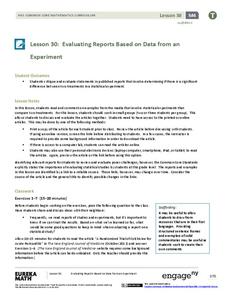
Evaluating Reports Based on Data from an Experiment
They say you can interpret statistics to say what you want them to. Teach your classes to recognize valid experimental results! Pupils analyze experiments and identify flaws in design or statistics.
EngageNY
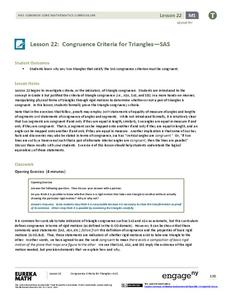
Congruence Criteria for Triangles—SAS
Looking for a different approach to triangle congruence criteria? Employ transformations to determine congruent triangles. Learners list the transformations required to map one triangle to the next. They learn to identify congruence...
Inside Mathematics
Archery
Put the better archer in a box. The performance task has pupils compare the performance of two archers using box-and-whisker plots. The resource includes sample responses that are useful in comparing individuals' work to others.
Ms. Amber Nakamura's Mathematics Website
Algebra Project
What would your dream house look like? A cottage? A medieval castle? High schoolers enrolled in Algebra design the perfect house while using slopes to write equations for various aspects of the project.
Mathematics Assessment Project
Representing Functions of Everyday Situations
Functions help make the world make more sense. Individuals model real-world situations with functions. They match a variety of contexts to different function types to finish a helpful resource.
Mathematics Assessment Project
Solving Linear Equations
Linear equations are the focus of activities that ask learners to first complete a task that involves interpreting algebraic expressions and solving linear equations. They then take part in a card activity matching...
Mathematics Assessment Project
Modeling Motion: Rolling Cups
Connect the size of a rolling cup to the size of circle it makes. Pupils view videos of cups of different sizes rolling in a circle. Using the videos and additional data, they attempt to determine a relationship between cup...
New York State Education Department
TASC Transition Curriculum: Workshop 7
Designed specifically for math instructors, the seventh workshop of a 15-part series allows time to explore Webb's DOK, ponder open-ended questions, and create lessons to apply what is learned. Teachers craft high-quality math problems...
EngageNY
TASC Transition Curriculum: Workshop 8
Lights, camera, action! Math educators consider how to improve their instruction by examining a model of the five-practice problem-solving model involving a movie theater. Participants examine cognitive demand in relation to problem...
American Statistical Association
Armspans
Young mathematicians collect data on the arm spans of classmates. Then they sort the data by measures of center, spread, and standard deviation. Finally, they compare groups, such as boys and girls, to interpret any differences.
Futures Channel
Folding Circles
Students investigate properties of circles. In this geometry activity, students differentiate between similarity and congruence as they observe polygons. They investigate properties of two and three dimensional shape.
Curated OER
Symmetry with Shapes
Students analyze a symmetrical stamp design with an equal balance of light and dark to create a pattern in succession. In this shape design lesson, students review concepts of sign, symbol and language across cultures. Students analyze...
Curated OER
Data Analysis Digital Display
Students create a survey online. In this math lesson, students graph survey data using flisti.com. They share and analyze their classmates' histogram.
Curated OER
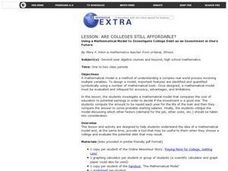
Are Colleges Still Affordable?
Students investigate mathematical model that compares cost of higher education to potential earnings in order to decide if the investment is a good one. They compute amount to be repaid each year for the life of a student loan and then...
Curated OER
Weather, Data, Graphs and Maps
Students collect data on the weather, graph and analyze it. In this algebra instructional activity, students interpret maps and are able to better plan their days based on the weather reading. They make predictions based on the type of...
Ohio Department of Education
I Can Name that Angle in One Measure! - Grade Eight
Collaborative groups work with geometry manipulatives to investigate conjectures about angles. They create a graphic organizer to use in summarizing relationships among angles in intersecting, perpendicular and parallel lines cut by a...
Mathematics Assessment Project
Representing Probabilities: Medical Testing
Test probability concepts with an activity that asks pupils to first complete a task investigating false positive in medical testing and then to evaluate sample responses to the same task.
Mathematics Assessment Project
Applying Angle Theorems
Polygon ... an empty bird cage? After finding the angles of a polygon, young mathematicians use the provided methods to solve the problem in multiple ways.
Howard County Schools
Exponential Decay Exploration
How can you model exponential decay? Explore different situations involving exponential decay functions and decreasing linear functions by performing activities with MandM candy, popcorn kernels, and number cubes.
American Statistical Association
Tell it Like it is!
Scholars apply prior knowledge of statistics to write a conclusion. They summarize using correct academic language and tell the story of the data.

