CK-12 Foundation
Irwin and Ruthie
Learners compare acceleration to displacement through an interactive tutorial that permits them to adjust the running strategy of two robots and watch them race. A graph displays the robot's velocity over time and another shows their...
Nuffield Foundation
Observing Osmosis, Plasmolysis, and Turgor in Plant Cells
Create the perfect conditions for osmosis. Young scholars use a microscope to observe plant cells exposed to distilled water or sodium chloride. They observe how osmosis creates turgid or plasmolyzed cells.
Center for Math and Science Education
Solar System Launch
Trying to understand the vastness of outer space can be quite a challenge for young scientists. Help put things in perspective with this cross-curricular activity as students work in pairs creating scaled models of the solar system,...
Curated OER
Let's Grow Plants!
Students read and dramatize the stories "The Tiny Seed" and "The Carrot Seed" as an introduction to seeds and what they become. They work in small groups to plant their own seeds and over the span of a week (+ or -)students keep track of...
Chemistry Collective
Chemical Potential: Staircase Demonstration
It's all uphill from here! Scholars examine the pattern of random particle motion up a staircase. The simulation shows how the linear increase in energy corresponds to an exponential decrease in particle concentration.
Baylor College
Needs of Plants
What better way to learn about plant life than by creating a class garden? Young botanists start with a brief discussion about radishes before planting seeds and watching them grow. To determine the importance of water, sunlight, and...
Discovery Education
Cool It!
Adjust the melting time of ice without varying the temperature! Learners experiment with different materials to decide how the materials affect the rate an ice cube melts. They then connect their findings to the conductivity of each...
Curated OER
Greenhouse in a Bottle
Young atmospheric scientists create models of an atmosphere with and without clouds to determine the effect of cloud cover on Earth's temperatures, as well as figuring out whether dark or light surfaces absorb more energy. You may wish...
Curated OER
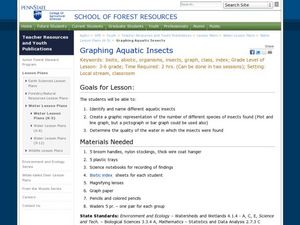
Graphing Aquatic Insects
Students identify aquatic insects. In this organism lesson, students locate aquatic insects near a local waterway and collect them. Students graph the amount of insects that they collected.
Curated OER
Exploring The Depths!
Fifth graders make a model of the ocean floor. In this ocean characteristics instructional activity, 5th graders complete a KWL chart about the ocean floor, use the Ocean Depth Data Sheet to create a graph, and create a 3-D model of the...
Curated OER
Conduction, Convection, Radiation, Oh My!
Students draw a line graph, and use graphing as a tool to discover more about conduction, convection and radiation. They should design their own experiment using heat sensitive paper to show they explain these 3 processes.
Curated OER
Mapping the Ocean Floor
Students construct and interpret a line graph of ocean floor depth and a bar graph comparing the height/depth of several well-known natural and man-made objects and places. In addition, they calculate the depth of two points using sonar...
Curated OER
The Effects of Light Intensity and Wavelength on the Rate of Photosynthesis
High schoolers use an on line website to simulate the effects of light intensity and wavelength on photosynthesis. In this photosynthesis lesson plan, students determine how wavelength of light and intensity of light affect the rate at...
Curated OER
A Tasty Solution
In this solutions worksheet, students complete a three step procedure and record the dissolving time of candy. Using their data they create a graph and answer 4 analysis questions.
Curated OER
Let's Measure
Students learn how to measure length using inch units. For this measurement lesson, students use two different units of measure to measure the length of a Leopard Shark and then use pattern blocks to measure its length. Students use...
Curated OER
Graphing Data from the Chemistry Laboratory
Students graph and analyze data using a spreadsheet.
Curated OER
Checking Test Comparability/Scattergrams
Students construct a scattergram graph. In this statistics lesson, students graph data by hand and using a spreadsheet program. They establish lines of best fit and draw conclusions using their graphs.
Curated OER
Introduction to Topographic Maps
Tenth graders create a topographic map and see how it represents different elevations. In this topographic maps lesson students read and interpret topographic maps.
Curated OER
Supersonic Dream
Students explore how fuel use affects the mass of different planes during flight and graph their results. They determine the per person fuel cost of a transatlantic flight for seven airplanes
Curated OER
More Rocket Science
Students observe two rocket science experiments, and create a graph to demonstrate the results. They draw a picture and write an explanation of the results of the experiments.
Curated OER
Is the Hudson River Too Salty to Drink?
In this estuary worksheet, students examine data about the salinity of the Hudson River, create a graph from given data and complete 12 short answer questions about the data and graph.
Mixing In Math
Mixing in Math: Growing Plants
Whether you have your class plant seeds or begin when sprouts are visible, math skills are used here to predict and track growth over time. Straw bar graphs show plant height on a given day while the graph as a whole shows changes over...
Curated OER
Water: From Neglect to Respect
The goal of this collection of lessons is to make middle schoolers more aware of the ways in which they are dependent upon water to maintain their standard of living. Learners compare water use in Lesotho to water use in the United...
Curated OER
Creating The Blueprints
Students engage in a lesson in order to create blueprints to design an original floorplan. They use graphing paper and drawing tools to demonstrate knowledge of the lesson objectives. Students label and use the right kind of proportions...


