Curated OER
Getting Graphs: Researching Genealogy-A Piece of Pie
Third graders research their genealogy. In this math lesson, 3rd graders collect data and create graphs and charts. A presentation of their findings is given.
Curated OER
Bar Graphs
Third graders examine the main parts of a bar graph and how to round up to the nearest tenth. They make an example of a bar graph and answer questions based on the graph using a list of state capitals and their average temperatures....
Curated OER
Skittle it Up
Students make a graph. In this graphing and Excel instructional activity, students work in groups and are given a bag of skittles. Students count the number of each color skittle and create a table in Excel. Students learn how to make a...
EngageNY
Comparing Quadratic, Square Root, and Cube Root Functions Represented in Different Ways
Need a real scenario to compare functions? This lesson has it all! Through application, individuals model using different types of functions. They analyze each in terms of the context using the key features of the graphs.
K12 Reader
Displaying Data
It's important to learn how to display data to make the information easier for people to understand. A reading activity prompts kids to use context clues to answer five comprehension questions after reading several paragraphs about...
EngageNY
Polynomial, Rational, and Radical Relationships
This assessment pair goes way beyond simple graphing, factoring and solving polynomial equations, really forcing learners to investigate the math ideas behind the calculations. Short and to-the-point questions build on one another,...
University of California
Seasons Lab Book
Unlock the mystery behind seasonal change with a collection of worksheets and activities. Whether they are drawing pictures of Earth's orbit around the sun or graphing the temperature and daylight hours of different locations...
EngageNY
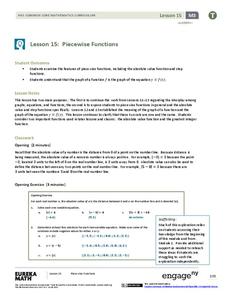
Piecewise Functions
Show your class members that if they can graph a linear function, they can graph an absolute value function. Groups create an absolute value graph using a table, then entertain the idea of an absolute value function defined as two...
EngageNY
Solution Sets to Equations with Two Variables
Can an equation have an infinite number of solutions? Allow your class to discover the relationship between the input and output variables in a two-variable equation. Class members explore the concept through tables and graphs and...
Willow Tree
Solving Equations and Inequalities with Absolute Value
The concept of absolute value can be difficult for learners to grasp. Reinforce their understanding of a basic absolute value expression and connect it to solving equations and inequalities. Scholars write two equations/inequalities to...
Bytes Arithmetic
Geometry Pad+
Graphing paper, pencil, ruler, protractor, and compass, all get replaced or supplemented with this dynamic geometry application. Here, you can create, move, and scale many different shapes, as well as, explore and change their properties...
101 Questions
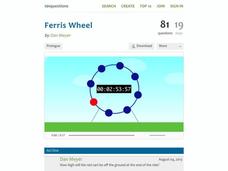
Ferris Wheel
Around and around you'll go! Learners analyze the periodic nature of a Ferris wheel. Using a trigonometric function, they make predictions about the location of a specific car at the end of the ride and its total trips around the circle.
Curated OER
Math Games for Skills and Concepts
A 27-page packet full of math games and activities builds on algebra, measurement, geometry, fractional, and graphing skills. Young mathematicians participate in math games collaboratively, promoting teamwork and skills practice.
Curated OER
Interpreting and Displaying Sets of Data
Learners explore the concept of interpreting data. In this interpreting data lesson, students make a line plot of themselves according to the number of cubes they can hold in their hand. Learners create their own data to graph and...
Curated OER
Spreadsheet Graphs
Students create graphs using information from spreadsheets. They select a topic from the following choices: website use, digital cameras, spreadsheets, calculators or educational software. They tally the class results and create an...
Curated OER
Graphs of Formulas
In this worksheet students fill out a function table after reading a short word problem. This is a good way for students to practice the necessary skills for solving word problems or setting up algebra equations.
Curated OER
Graphing Favorite Holidays
Students create spreadsheets and bar graphs based on results of survey of favorite holidays.
Curated OER
Dynamite Data
Second graders rotate through a variety of stations designed to offer practice in manipulating data. They sort, tally and count items and then create bar graphs, tables, and pie graphs to record their findings.
Curated OER
Reading and Making Pie Graphs
In this pie graphs worksheet, learners solve 10 different problems that include reading a pie graph. First, they use the pie graph to respond to 5 questions that follow. Students determine the year that had the smallest and largest...
Curated OER
Tree Measurement
Measure a tree? Yes, measure a tree! Students get outside and measure a tree's trunk, crown, and height. Each group compares their answers to determine if any re-measuring is necessary. Once back in the classroom, students make bar...
EngageNY
Curves from Geometry
Escape to investigate hyperbolas. Pupils take a look at what happens to the elliptical orbital path of a satellite that exceeds escape velocity as the opener to the eighth lesson in a unit of 23. Scholars analyze basic hyperbolas and how...
Open Text Book Store
Arithmetic for College Students: Worksheets
Loaded with concepts ranging from multiplying decimals to converting units to solving problems using the order of operations, a thorough practice packet is perfect for a fifth or sixth grade math classroom.
CK-12 Foundation
Conversions between Degrees and Radians: Charting Hours in the Day
Forget hours, divide the day into radians instead. Class members convert the angles in a pie chart of daily activities into radian measures. They add angle measures for multiple activities then determine a relationship between the radian...
Curated OER
Pie Graph
Fifth graders examine fractional parts of pie graphs. Given a bag of M&Ms, 5th graders interpret the data. They use a paper plate and colors to create a graph of the types of M&Ms represented.


