Curated OER
It's My Time!
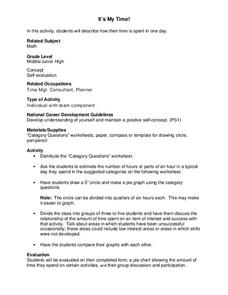
Students create a pie chart. In this time lesson, students determine the amount of time they spend on given activities. They create a pie chart diagraming the data. Students share their graphs with the class.
Curated OER
Math Lesson: What Do You Want to Know? - Country Statistics
Learners are able to identify the characteristics of a variety of graphs (i.e. bar graph, line graph, pie graph, scatter plot, population pyramids, etc.) They recognize how the type of data to be presented plays a role in choosing the...
Curated OER
Circles and Angles
Students identify tangents, chords and secants. In this geometry lesson, students graph circles and identify angles created by secant lines, tangent lines and chords.
Curated OER
An Introduction To Solving And Graphing Inequalities
Students graph inequalities and solve the equations. In this algebra lesson, students graph their solutions on a number line and create an inequality for a word problem.
Alabama Learning Exchange
Technology for Displaying Trigonometric Graph Behavior: Sine and Cosine
Students explore the concept of sine and cosine. In this sine and cosine instructional activity, students work in groups to graph sine and cosine functions. Students examine how coefficients in various parts of each parent...
Curated OER
Line Graphs and Commercial Costs
Young scholars investigate line graphs. In this middle school mathematics lesson, students compare and contrast different types of graphs and create line graphs based on the data provided.
Curated OER
Time Management
Students record their daily activities and graph the results using the educational software program called Inspiration. This lesson plan is intended for the upper-elementary classroom and includes resource links and activity extensions.
Curated OER
Box and Whiskers
Middle schoolers discover how to relate collected data with a box and whiskers graph in a number of formats. They collect, organize, create, and interpret a box and whiskers graph. Pupils interpret the difference between sets of data,...
Virginia Department of Education
Give or Take a Few
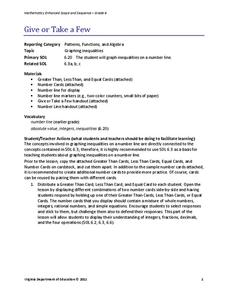
Young mathematicians extend their knowledge of rational numbers on a number line to graph inequalities by first using number cards to compare rational numbers. They finish by using similar reasoning to graph inequalities on a number line.
Mathematics Vision Project
Module 6: Trigonometric Functions
Create trigonometric functions from circles. The first lesson of the module begins by finding coordinates along a circular path created by a Ferris Wheel. As the lessons progress, pupils graph trigonometric functions and relate them to...
5280 Math
Pythagorean Triples
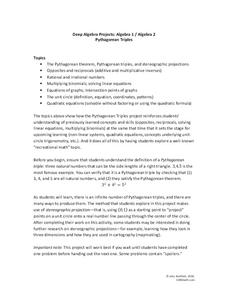
From Pythagorean triples to the unit circle. Learners use the Pythagorean Theorem to find Pythagorean triples and then relate their work to the unit circle in a fun algebra project. Their discovery that x^2+y^2 is always equal to one on...
Shodor Education Foundation
Conic Flyer
Graphing conics made easy. Individuals use an interactive to graph conic sections. The app can handle circles, vertical and horizontal parabolas, ellipses, and vertical and horizontal hyperbolas.
Virginia Department of Education
Scatterplots
Math is all fun and games with this activity! Learners use an activity designed around hula hoops to collect data. They create scatter plots with their data and then analyze the graphs for correlation.
Los Angeles County Office of Education
Assessment for the California Mathematics Standards Grade 2
Test scholars mathematic skills with an assessment addressing addition, subtraction, multiplication, place value, measurement, geometric shapes, expanded notation; and their ability to compare numbers, write number...
EngageNY
Mid-Module Assessment Task: Pre-Calculus Module 4
Challenge scholars to show what they know about properties and addition and subtraction formulas for trigonometric functions. The resource provides a mid-unit check on the progress toward mastery of trigonometric concepts. The areas...
Museum of Tolerance
Why is This True?
Are wages based on race? On gender? Class members research wages for workers according to race and gender, create graphs and charts of their data, and compute differences by percentages. They then share their findings with adults and...
CK-12 Foundation
Vertical Line Test: Exploration
What do vertical lines have to do with functions? Individuals slide a vertical line through four different graphs. They use that vertical line test to determine if the graphs represent functions.
Radford University
Marketing Mayhem: Advertising for Adolescents
You'll be sold on using the resource. Future consumers first conduct a sample survey on marketing strategies. They then consider how mass media influences their age groups and create presentations to display their findings.
Curated OER
Speed + Graphing = Winners!
Fifth graders take addition timed tests every day for a two week period. Using the data from the timed tests, they create a bar graph using Microsoft Excel computer software, a personal bar graph using graph paper and colored pencils,...
Curated OER
Graphing Data Brings Understanding
Students collect, graph and analyze data. In this statistics lesson, students use circle, pie, bar and lines to represent data. They analyze the data and make predictions bases on the scatter plots created.
Curated OER
Consistent Circles
Students create a design of a circle. In this geometry lesson, students identify the measure of the diameter and radius of a circle. They graph and analyze their collected data and write equations based on direct variation.
Curated OER
Circles Minilab
Students learn how to measure the diameter and circumference of a circle. In this circle activity, students organize their data to create a graph. Students utilize their graph to make an inference about the slope of pi.
Curated OER
Picture Graphs
First graders work with picture graphs, create their own individual graphs, and construct and read graphs.
Curated OER
Every Graph Tells A Story
Seventh graders explore linear equations. In this graphing activity, 7th graders explore constant rates of change. Students discover the real-life application of graphs and demonstrate their ability to read graphs and write...


