Curated OER
Data Analysis
Young statisticians use and interpret measures of center and spread such as mean, median, and mode as well as range. They use box plots to represent their data and answer questions regarding the correspondence between data sets and the...
Curated OER
When Will We Ever Use This? Predicting Using Graphs
Here are a set of graphing lessons that have a real-world business focus. Math skills include creating a scatter plot or line graph, fitting a line to a scatter plot, and making predictions. These lessons are aimed at an algebra 1...
Curated OER
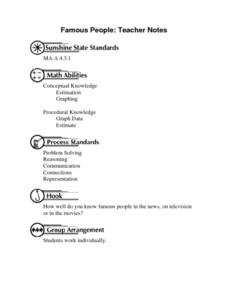
Famous People: Teacher Notes
Young statisticians practice creating scatter plots. First, they estimate the age of 14 people. Next, they write down the estimate in a table labeled x. Then write down their actual age in the table labeled y. Using these x and y...
Curated OER
Scrambled Stories II
Review story elements with your class. They will use examples from a story to develop critical-thinking questions. Then they use a graphic organizer to describe the setting, character, and plot of the story, focusing on how they...
Curated OER
Range, Mode, and Median
Fifth and sixth graders sort data from least to greatest and mark an X on the line plot to show how many of each number. Then they determine the range, mode, and median for the problem.
Curated OER
Telling Stories in Art: Symbols of a Life
Through a series of activities, learners are exposed to how artists use symbolic imagery to create the narrative of a subject’s life. They study The Birth of Alexander and some manuscripts kept at J. Paul Getty Museum. They then draft...
Illustrative Mathematics
Puzzle Times
Give your mathematicians this set of data and have them create a dot plot, then find mean and median. They are asked to question the values of the mean and median and decide why they are not equal. Have learners write their answers or...
Curated OER
Story Pyramids
Young writers generate descriptive words. They use pictures of various landscapes (from books, magazines, or the Internet) and complete a story pyramid. The pyramid (included here) asks to describe the main character, the setting, and...
Curated OER
Fast Talker - Ch 2 project
Tongue Twisters?! Create scatter plot graphs based on timing fellow classmates saying tongue twisters. Then investigate, display, and analyze the relationships based on functions. Wrap up this activity by making a...
Curated OER
We Tell Stories
Young readers bring characters to life by working in small groups to script and perform stories that contain a community concept. Detailed questions and activities are outlined for the class. Consider having your groups create...
Curated OER
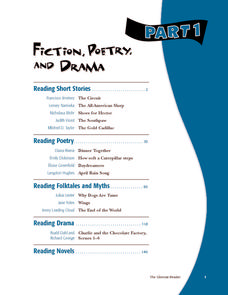
Fiction, Poetry, and Drama Part 1
Similar to a textbook, this resource includes multiple texts, plenty of explanation, lots of practice, and several graphic organizers. Use all of the materials, or pick and choose from such texts as "The Circuit," "Shoes for Hector,"...
Curated OER
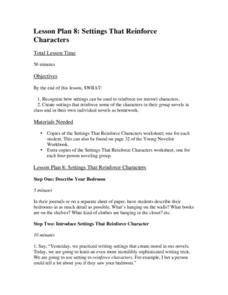
Lesson 8: Settings that Reinforce Characters
The best way to be a good writer is to read good writing. Learners read and discuss an excerpt from a book that will help them comprehend the relationship between setting and character. They will use what they've gleaned from discussion...
Curated OER
Points on a Line
Get your learners up and moving, all while reviewing numbers on the number line! For this activity, learners are grouped in teams outdoors. The teacher will have already created number lines on the ground (with chalk, tape, etc.), and...
Curated OER
A Day at the Beach
Help learners determine the rate of change for the temperature of sand. They will collect data on the temperature of wet and dry sand over time with a heat lamp overhead. Then make a scatter plot of the data and find a linear model to...
Scholastic
A Reading Guide to Sarah, Plain and Tall
Eliminate the hard work of creating an entire literature unit with this reading guide for the novel Sarah, Plain and Tall. From background information about the author and her motivation for writing the story to...
Annenberg Foundation
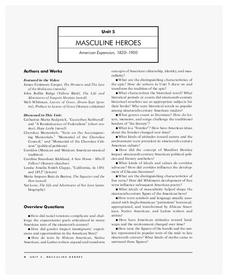
Masculine Heroes
What were the driving forces behind American expansion in the nineteenth century, and what were its effects? Scholars watch a video, read biographies, engage in discussion, write journals and poetry, draw, and create a multimedia...
Curated OER
Hand Span and Height
Is there a relationship between hand span width and height? Statisticians survey each other by taking measurements of both. A table that can hold data for 24 individuals is printed onto the worksheet, along with questions for analysis....
Core Knowledge Foundation
Fables and Stories Tell It Again!™ Read-Aloud Anthology
A read-aloud anthology focuses on fables. Over three weeks, first graders listen to various stories and then participate in lessons that cover story elements, including plot, characters, setting, and personification and explore...
ReadWriteThink
Literature Circles: Getting Started
Make reading more enjoyable and interactive with literature circles! Here you'll find detailed lessons to begin the literature circle process. Ten lessons introduce each role learners take on. Literature circle roles include...
Hawaiʻi State Department of Education
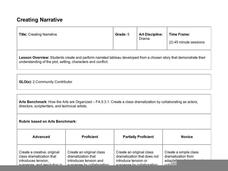
Creating Narrative
Plot, setting, characters, and conflict are common to both drama and narrative stories. Kids create narrated tableaus that show their understanding of the plot, setting, and conflict of a story they've recently read. The lesson plan...
Curated OER
Let's Plot Points
Use coordinate grid paper to plot points and identify shapes that are already plotted on the paper by saying their coordinates. Pupils also measure the distance between points and play the game Battleship. There are several web links and...
Curated OER
Plotting Numbers and Test
Sixth graders create a human number line. They determine the correct placement of various numbers ranging from -4 to 4. Additionally, they will determine the placement of numbers written as fractions and/or decimals.
Curated OER
Creating a Classic Comic Book
Students read a given play. They choose the key scenes from the play and write a narration to carry the plot line between those scenes. They create a comic book that depicts these key scenes, complete with pictures and text balloons.
Pennsylvania Department of Education
What is the Chance?
Fourth and fifth graders make predictions using data. In this analyzing data instructional activity, pupils use experimental data, frequency tables, and line plots to look for patterns in the data in order to determine chance. You will...


