Illustrative Mathematics
Walk-a-thon 2
During a walk-a-thon your learners must determine the walking rate of Julianna's progress. Using tables, graphs, and an equation, they must be able to calculate the time it took her to walk one mile and predict her distance based on the...
California Academy of Science
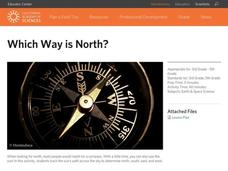
Which Way is North?
Who needs a compass to find cardinal directions? Just place a stick in the ground and record the movement of its shadow over the course of a day. Then, measure the shadow lengths in order to determine a north-south line. A simple...
CK-12 Foundation
Graphs in the Coordinate Plane: Functions on a Cartesian Plane
Connect the dots to graph a linear function. Young mathematicians use an interactive to first plot provided points on a coordinate plane. They connect these points with a line and then answer questions about the slope and y-intercept of...
CK-12 Foundation
Function Rules based on Graphs: Making Money in the Hat Business
Hats off to those learning about the graphs of functions. Individuals use an interactive to plot points representing profits for a hat business. They identify a quadratic equation to represent this function and answer challenge questions...
CK-12 Foundation
Polygon Classification in the Coordinate Plane
Classify this resource into the "Use" pile. Scholars use an interactive coordinate plane to plot polygons given coordinates for the vertices. They use properties to classify each polygon and answer a few challenge questions regarding the...
CK-12 Foundation
Order Real Numbers: Pie Baking Contest
Time is on your side. Scholars plot three points on number lines with different time units to represent the time it takes three people to bake pies. They determine the fastest baker and the difference in times between the bakers.
CK-12 Foundation
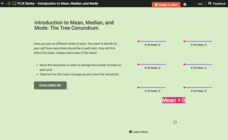
Introduction to Mean, Median, and Mode: The Tree Conundrum
How many trees should we plant? Using an interactive as a manipulative, individuals find the mean, median, and mode for sets of data. They determine the number of trees to plant in each plot of land to reach a statistical goal.
CK-12 Foundation
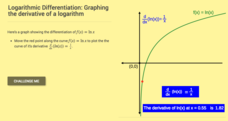
Logarithmic Differentiation: Graphing the Derivative of a Logarithm
Log the values of the derivative of a logarithm. The interactive plots the derivative of the natural logarithm. Learners first determine the derivative of natural logarithm and the general logarithm. Using the formulas for the...
CK-12 Foundation
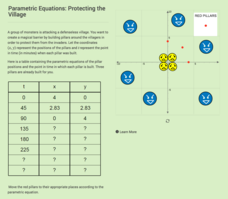
Parametric Equations: Protecting the Village
Determine the location of the pillars in time. Given a table of values for two parametric equations, pupils complete the table to determine the location and time it takes to build the pillars. Learners plot the points representing...
Serendip
Soap Opera Genetics – Genetics to Resolve Family Arguments
Did she cheat on her husband? Did the hospital switch the babies? Should they have children? As much as this sounds like the plot for a soap opera, all of these questions fit into a single lesson on genetics. Scholars read about three...
Penguin Books
A Teacher's Guide to the Signet Classic Edition of William Shakespeare's Twelfth Night
With the help of this teacher's guide, it won't take 12 nights for scholars to complete their study of William Shakespeare's romantic comedy about twins Viola and Sebastian. Pompous prigs, he shes, fatuous fools, and lovelorn lovers...
Penguin Books
A Teacher's Guide to the Signet Classic Edition of William Shakespeare's As You Like It
A boy is playing a girl disguised as a boy playing a girl. Welcome to William Shakespeare's comedy As You Like It. "And thereby hangs a tale."
Curated OER
Univariate Data Analysis
Students use given data to compare baseball players. They create box and whisker plots to compare the players and determine which they feel is the best player. Students use calculators to make box and whisker plots. They write paragraphs...
Curated OER
Best Guesser
Fifth graders develop strategies for estimating ages, and illustrate results by graphing and interpreting scatter plots to compare x and y coordinates.
Curated OER
Tech Algebra: A Statistics Study
Students use the internet to gather a minimum of thirty pieces of data. Students create box and whisker graphs, and stem and leaf plots from the information. They calculate mean, median, mode, and range. Students write a summary and...
Curated OER
Reading Stories in Art
Students study how artists tell stories using visual images by identifying and comparing elements of narrative (setting, characters, and plot) in a painting and a Greek vase.
Curated OER
Measuring Mania
Students rotate through stations in the classroom, completing different types of measurements. These measurements are placed into a spreadsheet, and a scatter plot is generated. They type an explanation of their results in correlation...
Curated OER
Record 'The' Results
Third graders predict how many times they'll see the word "the" in a newspaper page and highlight all the "the"s they find. After reviewing definitions of range, median, mode, mean they create a Stem and Leaf Plot and a Back-to-Back Stem...
Curated OER
Story Blender
Fifth graders write a story with many paragraphs that include a plot, setting, and ending. In this writing lesson plan, 5th graders create stories as a class.
Curated OER
Made for the Movies
Students create a movie flyer to advertise the novel that the class has just finished reading in small groups. They search the Internet, format their flyer, select a slogan for their film, write a brief plot summary, without giving away...
Curated OER
M&M Exponential Activity
Students create a scatter plot of their experimental data. In this algebra lesson, students use M&M's to determine an algebraic model. They discuss results in class.
Curated OER
The Lion, The Witch, and The Wardrobe: A Literature Evaluation Project
Sixth graders read and analyze The Lion, The Witch, and The Wardrobe. They study the elements of literature found in the book. Students create an elements of literature flip book that shows the various elements of literature in the novel.
Curated OER
Reaching New Heights
Students explore the relationship between two variables. Students measure their arm span and height. They gather this class data to design a scatter plot. Students interpret the meaning of individual coordinates and the overall graph....
Curated OER
Statistical Accuracy and Reliability
Ninth graders assess the accuracy and reliability of current survey data and how it is represented. They design a survey, collect data, and use technology to analyze the data and present the results. Students examine scatter plots and...

